Estimated Value: $174,000 - $244,000
4
Beds
2
Baths
1,920
Sq Ft
$102/Sq Ft
Est. Value
About This Home
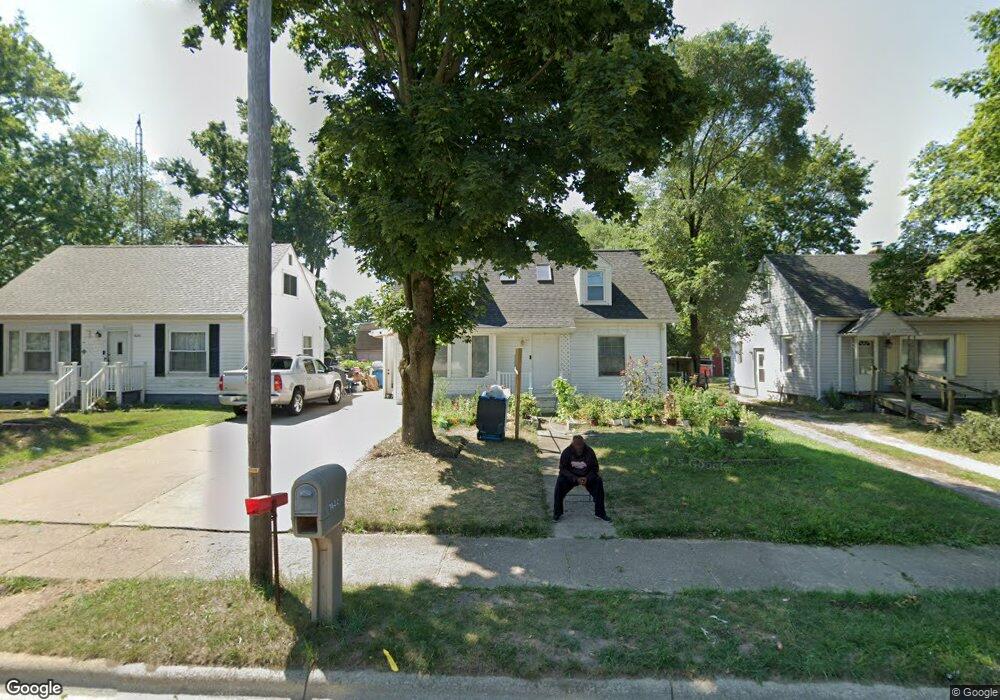
This home is located at 1622 Lake St, Niles, MI 49120 and is currently estimated at $196,284, approximately $102 per square foot. 1622 Lake St is a home located in Berrien County with nearby schools including Ballard Elementary School, Ring Lardner Middle School, and Oak Manor Sixth Grade Center.
Ownership History
Date
Name
Owned For
Owner Type
Purchase Details
Closed on
Jul 25, 2011
Sold by
Mondol Augustine and Mondol Lena
Bought by
Sarkar Kamona A and Sarkar Albert S
Current Estimated Value
Home Financials for this Owner
Home Financials are based on the most recent Mortgage that was taken out on this home.
Original Mortgage
$85,634
Outstanding Balance
$58,941
Interest Rate
4.52%
Mortgage Type
Future Advance Clause Open End Mortgage
Estimated Equity
$137,343
Purchase Details
Closed on
Apr 12, 2005
Sold by
Jacobs Tracy L and Peters Tracy L
Bought by
Mondol Augustine and Mondol Lena
Home Financials for this Owner
Home Financials are based on the most recent Mortgage that was taken out on this home.
Original Mortgage
$84,514
Interest Rate
5.88%
Mortgage Type
Credit Line Revolving
Purchase Details
Closed on
Jun 25, 2002
Purchase Details
Closed on
Nov 10, 1999
Purchase Details
Closed on
Aug 12, 1991
Purchase Details
Closed on
Mar 26, 1991
Purchase Details
Closed on
Dec 6, 1990
Create a Home Valuation Report for This Property
The Home Valuation Report is an in-depth analysis detailing your home's value as well as a comparison with similar homes in the area
Home Values in the Area
Average Home Value in this Area
Purchase History
| Date | Buyer | Sale Price | Title Company |
|---|---|---|---|
| Sarkar Kamona A | $100,000 | Meridian Title Corp | |
| Mondol Augustine | $104,995 | -- | |
| -- | $99,000 | -- | |
| -- | -- | -- | |
| -- | $26,000 | -- | |
| -- | $15,900 | -- | |
| -- | $14,800 | -- |
Source: Public Records
Mortgage History
| Date | Status | Borrower | Loan Amount |
|---|---|---|---|
| Open | Sarkar Kamona A | $85,634 | |
| Previous Owner | Mondol Augustine | $84,514 |
Source: Public Records
Tax History Compared to Growth
Tax History
| Year | Tax Paid | Tax Assessment Tax Assessment Total Assessment is a certain percentage of the fair market value that is determined by local assessors to be the total taxable value of land and additions on the property. | Land | Improvement |
|---|---|---|---|---|
| 2025 | $1,612 | $67,100 | $0 | $0 |
| 2024 | $1,268 | $66,000 | $0 | $0 |
| 2023 | $1,216 | $59,100 | $0 | $0 |
| 2022 | $1,158 | $43,000 | $0 | $0 |
| 2021 | $1,419 | $38,600 | $2,300 | $36,300 |
| 2020 | $1,404 | $37,900 | $0 | $0 |
| 2019 | $1,386 | $35,400 | $1,600 | $33,800 |
| 2018 | $1,360 | $35,400 | $0 | $0 |
| 2017 | $1,413 | $42,200 | $0 | $0 |
| 2016 | $1,382 | $37,800 | $0 | $0 |
| 2015 | $1,378 | $36,700 | $0 | $0 |
| 2014 | $1,102 | $36,900 | $0 | $0 |
Source: Public Records
Map
Nearby Homes
- 1405 Sheffield Ave
- 1630 Forest Trail
- 31829 Heritage Place
- 1223 Airport Rd
- 501 & 505 N Twelfth St
- 622 N 13th St
- 645 N 11th St
- 626 N 12th St
- 534 James St
- 1603 N 5th St
- 1314 Ferry St
- 1610 N 5th St
- 712 Wayne St
- 2802 Primrose Ct
- 1642 Cedar St
- 1710 Cedar St
- 1123 N 9th St
- 1201 N 6th St
- 1723 Broadway St
- 1639 Oak St
- 1618 Lake St
- 1626 Lake St
- 1614 Lake St
- 1634 Lake St
- 1610 Lake St
- 1621 Clarendon Ave
- 1617 Clarendon Ave
- 1625 Clarendon Ave
- 1606 Lake St
- 1609 Clarendon Ave
- 1633 Clarendon Ave
- 1601 Lake St
- 1605 Clarendon Ave
- 1601 Clarendon Ave
- 1544 Lake St
- 1624 Clarendon Ave
- 1620 Clarendon Ave
- 1628 Clarendon Ave
- 1545 Clarendon Ave
- 1612 Clarendon Ave