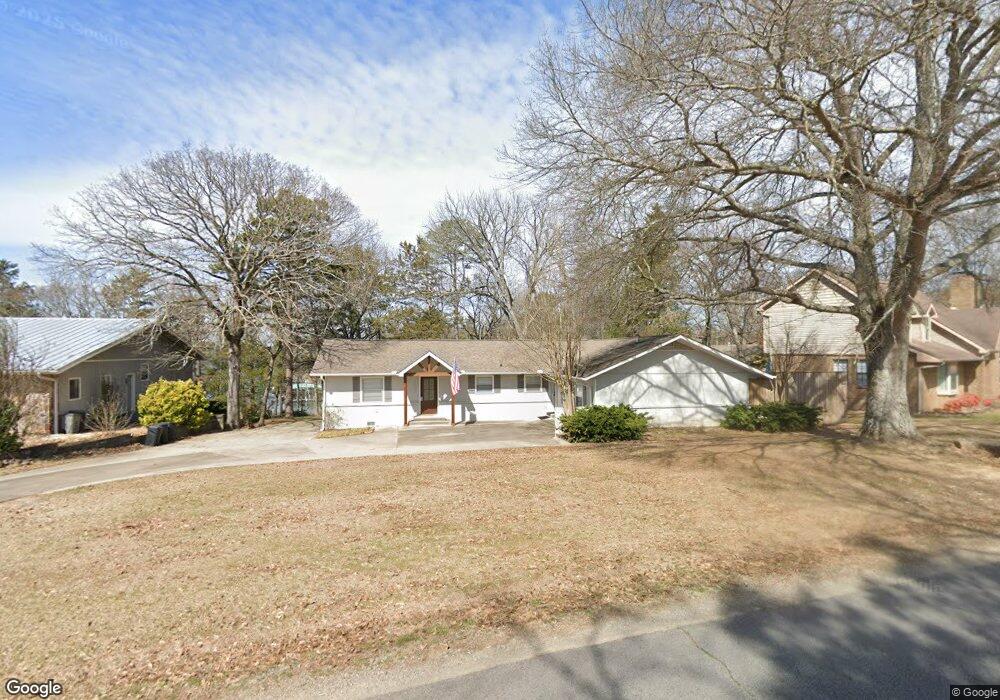
1622 Lakeshore Dr Heber Springs, AR 72543
Estimated Value: $360,000 - $517,447
3
Beds
2
Baths
2,175
Sq Ft
$194/Sq Ft
Est. Value
About This Home
This home is located at 1622 Lakeshore Dr, Heber Springs, AR 72543 and is currently estimated at $422,862, approximately $194 per square foot. 1622 Lakeshore Dr is a home located in Cleburne County with nearby schools including Heber Springs Elementary School, Heber Springs Middle School, and Heber Springs High School.
Ownership History
Date
Name
Owned For
Owner Type
Purchase Details
Closed on
May 30, 2017
Sold by
Dale Investments
Bought by
Lile Farming Company
Current Estimated Value
Purchase Details
Closed on
May 11, 2012
Sold by
Foster Lyle D and Foster Lael Wallace
Bought by
Dale Investments Llc
Home Financials for this Owner
Home Financials are based on the most recent Mortgage that was taken out on this home.
Original Mortgage
$344,000
Interest Rate
4.02%
Mortgage Type
Future Advance Clause Open End Mortgage
Purchase Details
Closed on
Jan 28, 2008
Sold by
Stanley James R and Stanley Imelda R
Bought by
Foster Lyle D and Foster Lael Wallace
Home Financials for this Owner
Home Financials are based on the most recent Mortgage that was taken out on this home.
Original Mortgage
$232,000
Interest Rate
6.11%
Mortgage Type
New Conventional
Purchase Details
Closed on
May 1, 1984
Bought by
Stanley James R
Create a Home Valuation Report for This Property
The Home Valuation Report is an in-depth analysis detailing your home's value as well as a comparison with similar homes in the area
Home Values in the Area
Average Home Value in this Area
Purchase History
| Date | Buyer | Sale Price | Title Company |
|---|---|---|---|
| Lile Farming Company | $285,000 | None Available | |
| Dale Investments Llc | -- | First National Title | |
| Foster Lyle D | $290,000 | None Available | |
| Stanley James R | $86,000 | -- |
Source: Public Records
Mortgage History
| Date | Status | Borrower | Loan Amount |
|---|---|---|---|
| Previous Owner | Dale Investments Llc | $344,000 | |
| Previous Owner | Foster Lyle D | $232,000 |
Source: Public Records
Tax History Compared to Growth
Tax History
| Year | Tax Paid | Tax Assessment Tax Assessment Total Assessment is a certain percentage of the fair market value that is determined by local assessors to be the total taxable value of land and additions on the property. | Land | Improvement |
|---|---|---|---|---|
| 2024 | $2,647 | $61,561 | $16,000 | $45,561 |
| 2023 | $2,647 | $61,561 | $16,000 | $45,561 |
| 2022 | $2,498 | $61,561 | $16,000 | $45,561 |
| 2021 | $2,260 | $52,553 | $15,000 | $37,553 |
| 2020 | $2,260 | $52,553 | $15,000 | $37,553 |
| 2019 | $2,260 | $52,553 | $15,000 | $37,553 |
| 2018 | $2,249 | $52,553 | $15,000 | $37,553 |
| 2017 | $2,009 | $47,491 | $15,000 | $32,491 |
| 2016 | $2,100 | $49,640 | $25,000 | $24,640 |
| 2015 | $2,100 | $49,640 | $25,000 | $24,640 |
| 2014 | $2,100 | $49,640 | $25,000 | $24,640 |
Source: Public Records
Map
Nearby Homes
- 1721 Lakeshore Dr
- 2002 Lakeshore Dr
- 000 Edgewater Cove
- 603 Edgewater Cove
- 602 Edgewater Cove
- 906 Eagle Bay Dr
- Lot 4 Thelma St
- 1104 Wildwood Ln
- 307 Lo Hawk Dr
- 000 Wedding Ford Rd
- 508 Mustang Dr
- 000 Huntington Place
- 209 Trailwood Dr
- 912 Lakeshore Dr
- 2329 E Smokey Ridge
- 970 Anderson Cir
- 0 Woodland Bluff Dr
- 1604 Ridgefield Dr
- 1412 Ridgefield Dr
- 1408 Lee Place
- 1704 Lakeshore Dr
- 1618 Lakeshore Dr
- 1706 Lakeshore Dr
- 1705 Lakeshore Dr
- 1708 Lakeshore Dr
- 1525 Lakeshore Dr
- 1614 Lakeshore Dr
- 1710 Lakeshore Dr
- 1606 Lakeshore Dr
- 1711 Lakeshore Dr
- 1530 Lakeshore Dr
- 1714 Lakeshore Dr
- 1715 Lakeshore Dr
- 1520 Lakeshore Dr
- 1722 Lakeshore Dr
- 1514 Lakeshore Dr
- 1730 Lakeshore Dr
- 0 Lakeshore Dr
- 1506 Lakeshore Dr
- 1751 Lakeshore Dr