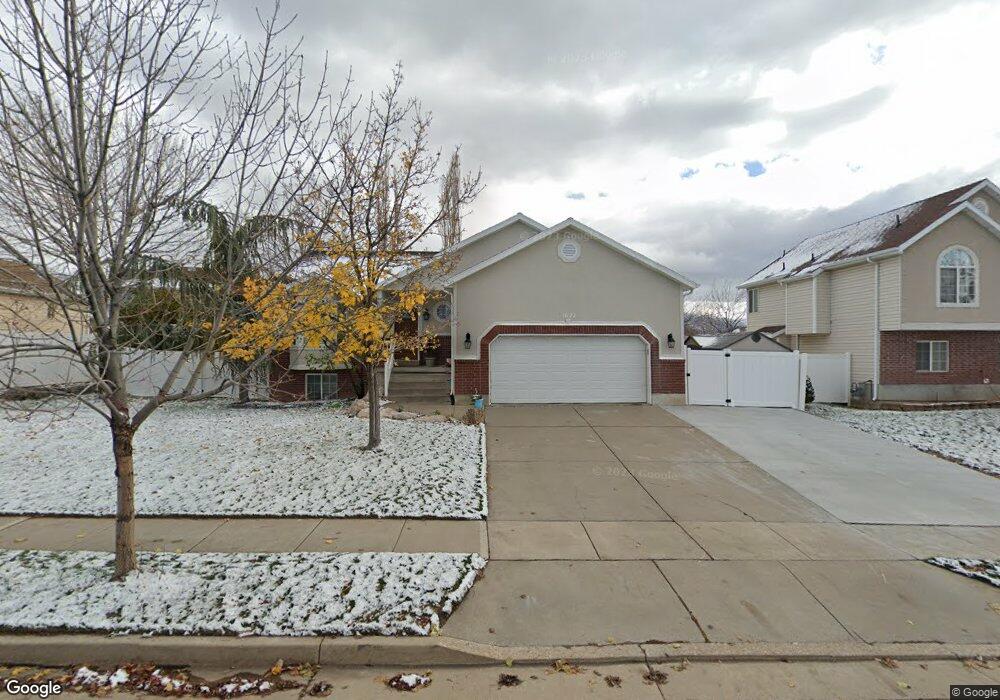
1622 N 25 E Layton, UT 84041
Estimated Value: $506,686 - $578,000
4
Beds
3
Baths
2,665
Sq Ft
$198/Sq Ft
Est. Value
About This Home
This home is located at 1622 N 25 E, Layton, UT 84041 and is currently estimated at $526,672, approximately $197 per square foot. 1622 N 25 E is a home located in Davis County with nearby schools including Lincoln Elementary School, North Layton Junior High School, and Northridge High School.
Ownership History
Date
Name
Owned For
Owner Type
Purchase Details
Closed on
Jun 27, 2012
Sold by
Smith Jeremy M and Smith Karla M
Bought by
Jklmn Homes 100 Llc
Current Estimated Value
Purchase Details
Closed on
Oct 13, 2006
Sold by
Hansen Chad Tyler and Hansen Heidi
Bought by
Smith Jeremy M and Smith Karla M
Home Financials for this Owner
Home Financials are based on the most recent Mortgage that was taken out on this home.
Original Mortgage
$186,000
Interest Rate
6.44%
Mortgage Type
Purchase Money Mortgage
Purchase Details
Closed on
Jan 22, 1999
Sold by
Coxey Construction & Remodeling Inc
Bought by
Hansen Chad Tyler and Hansen Heidi
Home Financials for this Owner
Home Financials are based on the most recent Mortgage that was taken out on this home.
Original Mortgage
$139,350
Interest Rate
6.73%
Create a Home Valuation Report for This Property
The Home Valuation Report is an in-depth analysis detailing your home's value as well as a comparison with similar homes in the area
Home Values in the Area
Average Home Value in this Area
Purchase History
| Date | Buyer | Sale Price | Title Company |
|---|---|---|---|
| Jklmn Homes 100 Llc | -- | None Available | |
| Smith Jeremy M | -- | First American Title | |
| Hansen Chad Tyler | -- | Bonneville Title Company |
Source: Public Records
Mortgage History
| Date | Status | Borrower | Loan Amount |
|---|---|---|---|
| Previous Owner | Smith Jeremy M | $186,000 | |
| Previous Owner | Hansen Chad Tyler | $139,350 |
Source: Public Records
Tax History
| Year | Tax Paid | Tax Assessment Tax Assessment Total Assessment is a certain percentage of the fair market value that is determined by local assessors to be the total taxable value of land and additions on the property. | Land | Improvement |
|---|---|---|---|---|
| 2025 | $2,494 | $261,800 | $99,967 | $161,833 |
| 2024 | $2,382 | $251,900 | $116,604 | $135,296 |
| 2023 | $2,463 | $459,000 | $139,759 | $319,241 |
| 2022 | $2,527 | $255,750 | $73,554 | $182,196 |
| 2021 | $2,305 | $348,000 | $102,285 | $245,715 |
| 2020 | $2,078 | $301,000 | $86,440 | $214,560 |
| 2019 | $2,016 | $286,000 | $82,440 | $203,560 |
| 2018 | $1,847 | $263,000 | $82,440 | $180,560 |
| 2016 | $1,786 | $131,175 | $26,096 | $105,079 |
| 2015 | $1,828 | $127,490 | $26,096 | $101,394 |
| 2014 | $1,800 | $128,356 | $25,821 | $102,535 |
| 2013 | -- | $123,132 | $31,103 | $92,029 |
Source: Public Records
Map
Nearby Homes
Your Personal Tour Guide
Ask me questions while you tour the home.