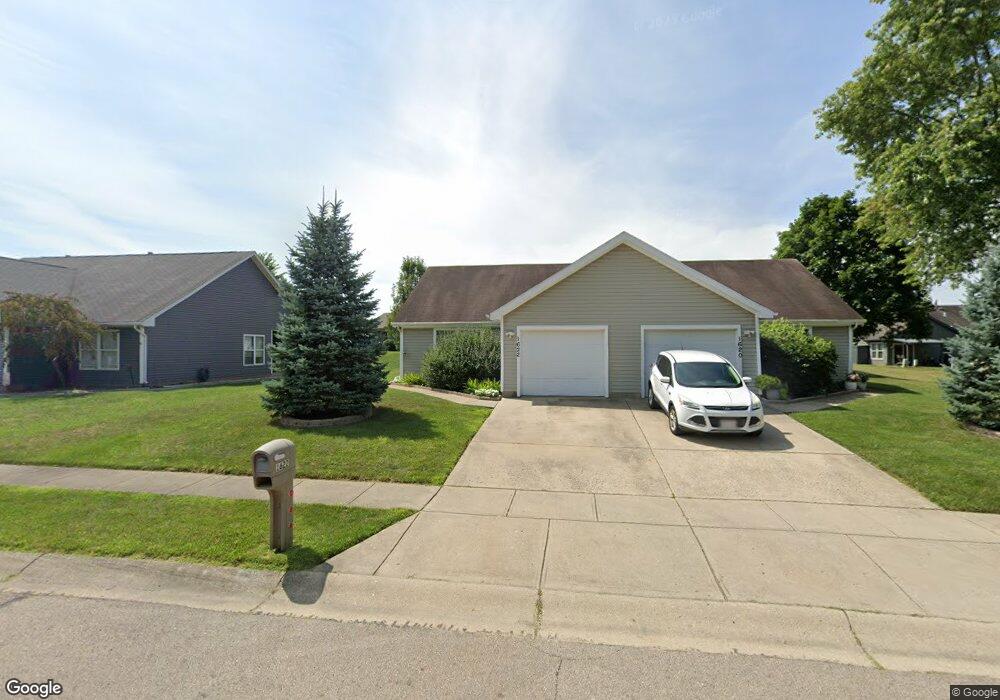
1622 Rosina Dr Miamisburg, OH 45342
Estimated Value: $215,000 - $329,000
4
Beds
4
Baths
2,148
Sq Ft
$136/Sq Ft
Est. Value
About This Home
This home is located at 1622 Rosina Dr, Miamisburg, OH 45342 and is currently estimated at $292,546, approximately $136 per square foot. 1622 Rosina Dr is a home located in Montgomery County with nearby schools including Miamisburg High School and Bethel Baptist School.
Ownership History
Date
Name
Owned For
Owner Type
Purchase Details
Closed on
Oct 4, 2011
Sold by
Secretary Of Housing & Urban Development
Bought by
Colwell Dorothy L and Colwell John L
Current Estimated Value
Home Financials for this Owner
Home Financials are based on the most recent Mortgage that was taken out on this home.
Original Mortgage
$72,080
Outstanding Balance
$6,490
Interest Rate
3.32%
Mortgage Type
New Conventional
Estimated Equity
$286,056
Purchase Details
Closed on
Jan 12, 2011
Sold by
Citimortgage Inc
Bought by
The Secretary Of Housing & Urban Develop
Purchase Details
Closed on
Jan 6, 2011
Sold by
Meehan Jason B
Bought by
Citimortgage Inc
Purchase Details
Closed on
May 28, 1998
Sold by
Beachler Jack E and Beachler Rosina C
Bought by
Meehan Rebecca S
Home Financials for this Owner
Home Financials are based on the most recent Mortgage that was taken out on this home.
Original Mortgage
$150,470
Interest Rate
7.27%
Create a Home Valuation Report for This Property
The Home Valuation Report is an in-depth analysis detailing your home's value as well as a comparison with similar homes in the area
Home Values in the Area
Average Home Value in this Area
Purchase History
| Date | Buyer | Sale Price | Title Company |
|---|---|---|---|
| Colwell Dorothy L | $90,100 | None Available | |
| The Secretary Of Housing & Urban Develop | -- | None Available | |
| Citimortgage Inc | $120,000 | None Available | |
| Meehan Rebecca S | $28,500 | -- | |
| Meehan Rebecca S | $28,500 | -- |
Source: Public Records
Mortgage History
| Date | Status | Borrower | Loan Amount |
|---|---|---|---|
| Open | Colwell Dorothy L | $72,080 | |
| Previous Owner | Meehan Rebecca S | $150,470 |
Source: Public Records
Tax History Compared to Growth
Tax History
| Year | Tax Paid | Tax Assessment Tax Assessment Total Assessment is a certain percentage of the fair market value that is determined by local assessors to be the total taxable value of land and additions on the property. | Land | Improvement |
|---|---|---|---|---|
| 2024 | $5,179 | $79,460 | $12,250 | $67,210 |
| 2023 | $5,179 | $79,460 | $12,250 | $67,210 |
| 2022 | $4,371 | $56,760 | $8,750 | $48,010 |
| 2021 | $3,880 | $56,760 | $8,750 | $48,010 |
| 2020 | $3,871 | $56,760 | $8,750 | $48,010 |
| 2019 | $3,617 | $48,640 | $8,750 | $39,890 |
| 2018 | $3,629 | $48,640 | $8,750 | $39,890 |
| 2017 | $3,585 | $48,640 | $8,750 | $39,890 |
| 2016 | $3,260 | $42,610 | $8,750 | $33,860 |
| 2015 | $2,471 | $42,610 | $8,750 | $33,860 |
| 2014 | $2,471 | $42,610 | $8,750 | $33,860 |
| 2012 | -- | $44,780 | $10,500 | $34,280 |
Source: Public Records
Map
Nearby Homes
- 1734 Rosina Dr
- 1035 Woods View Ct
- 1045 S Linden Ave
- 00 Benner Rd
- 1013 S Heincke Rd
- 902 Althea Dr
- 1808 Burnside Dr
- 807 Dunaway St
- 766 Dunaway St
- 811 Moon Ct
- Hudson Plan at Deer Valley
- Alberti Ranch Plan at Deer Valley
- Allegheny Plan at Deer Valley
- Bramante Ranch Plan at Deer Valley
- 727 Harnam Ct
- 615 Burnside Dr
- 2127 Carrington Ln
- 1265 Deer Valley Dr
- 1132 Nouvelle Dr
- 2141 Rosina Dr
- 1620 Rosina Dr
- 1630 Rosina Dr
- 1627 Tamworth Cir
- 1627 Tamworth Cir Unit 1627
- 1602 Rosina Dr
- 1615 Tamworth Cir
- 1603 Tamworth Cir
- 1635 Tamworth Cir
- 1601 Tamworth Cir
- 1645 Tamworth Cir
- 1622 Tamworth Cir
- 1203 Audene Ct
- 1632 Tamworth Cir
- 1612 Tamworth Cir
- 1203 Audene Ct
- 1211 Audene Ct
- 1642 Tamworth Cir
- 1655 Tamworth Cir
- 1602 Tamworth Cir
- 1221 Audene Ct