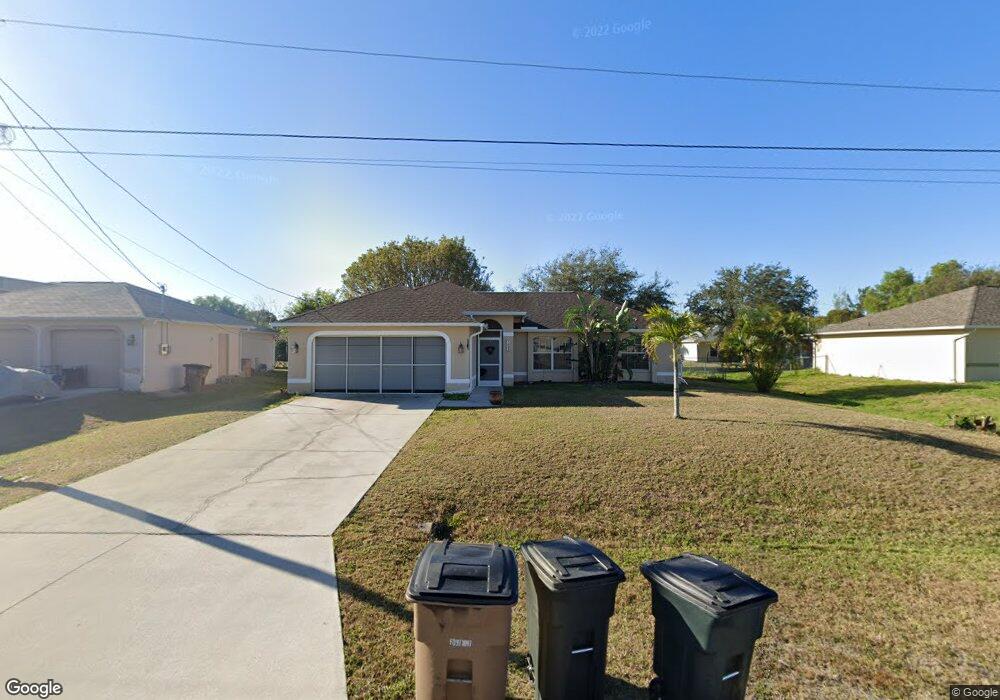
1622 SW 25th Ln Cape Coral, FL 33914
Pelican NeighborhoodEstimated Value: $283,162 - $326,000
3
Beds
2
Baths
1,479
Sq Ft
$206/Sq Ft
Est. Value
About This Home
This home is located at 1622 SW 25th Ln, Cape Coral, FL 33914 and is currently estimated at $305,041, approximately $206 per square foot. 1622 SW 25th Ln is a home located in Lee County with nearby schools including Cape Elementary School, Caloosa Elementary School, and Tropic Isles Elementary School.
Ownership History
Date
Name
Owned For
Owner Type
Purchase Details
Closed on
Feb 8, 2011
Sold by
Letizia Adrian Ann and Perez Adrian Ann
Bought by
Perez Louis R and Perez Bonnie F
Current Estimated Value
Purchase Details
Closed on
Sep 20, 2006
Sold by
Perez Louis Raul
Bought by
Perez Adrian Ann
Purchase Details
Closed on
Feb 14, 2001
Sold by
Bartoline Richard L
Bought by
Perez Louis R and Perez Emily A
Home Financials for this Owner
Home Financials are based on the most recent Mortgage that was taken out on this home.
Original Mortgage
$80,400
Interest Rate
7.03%
Purchase Details
Closed on
May 16, 2000
Sold by
Clerk Circuit Court
Bought by
Bartoline Richard L
Create a Home Valuation Report for This Property
The Home Valuation Report is an in-depth analysis detailing your home's value as well as a comparison with similar homes in the area
Home Values in the Area
Average Home Value in this Area
Purchase History
| Date | Buyer | Sale Price | Title Company |
|---|---|---|---|
| Perez Louis R | -- | Attorney | |
| Perez Adrian Ann | -- | None Available | |
| Perez Louis R | $3,900 | -- | |
| Bartoline Richard L | $600 | -- |
Source: Public Records
Mortgage History
| Date | Status | Borrower | Loan Amount |
|---|---|---|---|
| Previous Owner | Bartoline Richard L | $20,000 | |
| Previous Owner | Perez Louis R | $80,400 |
Source: Public Records
Tax History Compared to Growth
Tax History
| Year | Tax Paid | Tax Assessment Tax Assessment Total Assessment is a certain percentage of the fair market value that is determined by local assessors to be the total taxable value of land and additions on the property. | Land | Improvement |
|---|---|---|---|---|
| 2025 | $2,812 | $88,922 | -- | -- |
| 2024 | $2,726 | $86,416 | -- | -- |
| 2023 | $2,726 | $78,899 | $0 | $0 |
| 2022 | $2,653 | $81,455 | $0 | $0 |
| 2021 | $2,603 | $165,098 | $24,260 | $140,838 |
| 2020 | $2,534 | $77,991 | $0 | $0 |
| 2019 | $2,469 | $76,238 | $0 | $0 |
| 2018 | $2,448 | $74,816 | $0 | $0 |
| 2017 | $2,448 | $73,277 | $0 | $0 |
| 2016 | $2,498 | $119,594 | $13,278 | $106,316 |
| 2015 | $2,490 | $101,503 | $9,494 | $92,009 |
| 2014 | -- | $96,598 | $7,889 | $88,709 |
| 2013 | -- | $90,799 | $5,762 | $85,037 |
Source: Public Records
Map
Nearby Homes
- 623 SW 25th Ln
- 2514 SW 17th Ave
- 1631 SW 25th Terrace
- 2518 SW 17th Ave
- 2510 SW 17th Ave
- 2534 SW 17th Ave
- 2502 SW 17th Ave
- Plan 2169 at Cape Coral-South
- Plan 2265 at Cape Coral-South
- Plan 1755 at Cape Coral-South
- Plan 2010 at Cape Coral-South
- Plan 2117 at Cape Coral-South
- 2622 SW 17th Ave
- 1519 SW 25th St
- 2101 SW 26th Terrace
- 2607 Chiquita Blvd S
- 1805 SW 25th St
- 2519 SW 15th Ave
- 2701 Chiquita Blvd S
- 1813 SW 26th St
- 1621 SW 26th St
- 1617 SW 26th St
- 1614 SW 25th Ln
- 1627 SW 26th St
- 1621 SW 25th Ln Unit 71
- 710 SW 25th Ln Unit 1
- 1613 SW 26th St
- 1617 SW 25th Ln
- 1632 SW 25th Ln Unit 71
- 1610 SW 25th Ln
- 1613 SW 25th Ln
- 1631 SW 25th Ln
- 1631 SW 25th Ln
- 1627 SW 25th Ln
- 1609 SW 25th Ln
- 1618 SW 25th Terrace
- 1628 SW 25th Terrace
- 1605 SW 26th St
- 1614 SW 25th Terrace