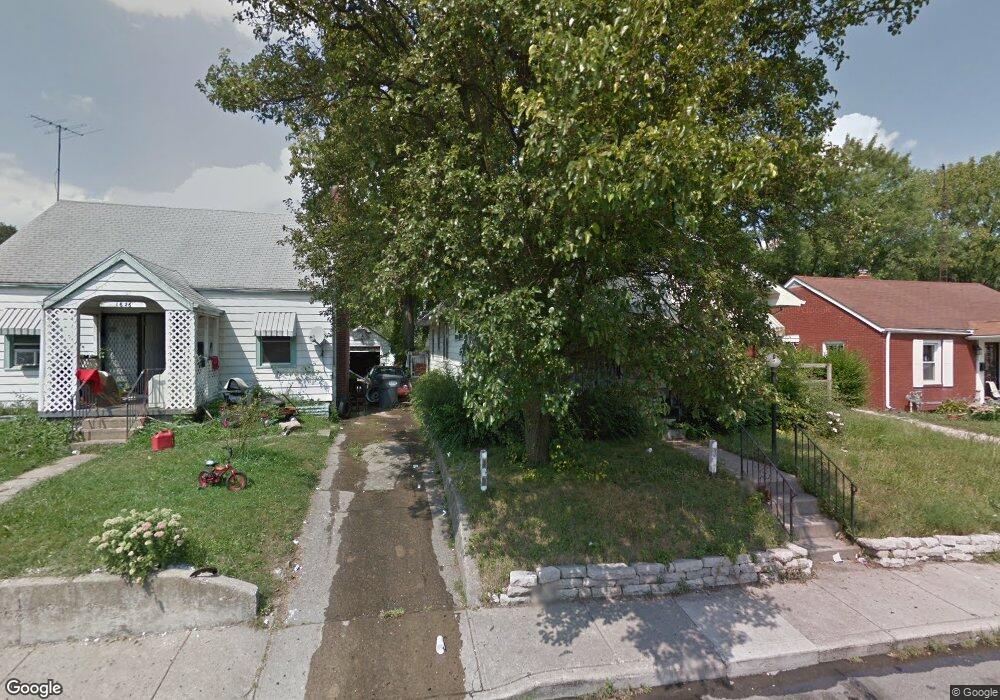
1622 W 8th St Anderson, IN 46016
Estimated Value: $73,000 - $133,883
2
Beds
1
Bath
1,092
Sq Ft
$92/Sq Ft
Est. Value
About This Home
This home is located at 1622 W 8th St, Anderson, IN 46016 and is currently estimated at $100,971, approximately $92 per square foot. 1622 W 8th St is a home located in Madison County with nearby schools including Eastside Elementary School, Highland Middle School, and Anderson High School.
Ownership History
Date
Name
Owned For
Owner Type
Purchase Details
Closed on
Mar 12, 2025
Sold by
Se Housing Llc
Bought by
Halberd Llc-S 1622 W 8Th St Protected Series
Current Estimated Value
Home Financials for this Owner
Home Financials are based on the most recent Mortgage that was taken out on this home.
Original Mortgage
$101,250
Outstanding Balance
$100,734
Interest Rate
6.89%
Mortgage Type
New Conventional
Estimated Equity
$237
Purchase Details
Closed on
Aug 30, 2021
Sold by
Bolt John G and Bolt Elizabeth A
Bought by
Se Housing Llc
Create a Home Valuation Report for This Property
The Home Valuation Report is an in-depth analysis detailing your home's value as well as a comparison with similar homes in the area
Home Values in the Area
Average Home Value in this Area
Purchase History
| Date | Buyer | Sale Price | Title Company |
|---|---|---|---|
| Halberd Llc-S 1622 W 8Th St Protected Series | $135,000 | Rowland Title | |
| Se Housing Llc | $23,000 | None Available |
Source: Public Records
Mortgage History
| Date | Status | Borrower | Loan Amount |
|---|---|---|---|
| Open | Halberd Llc-S 1622 W 8Th St Protected Series | $101,250 |
Source: Public Records
Tax History Compared to Growth
Tax History
| Year | Tax Paid | Tax Assessment Tax Assessment Total Assessment is a certain percentage of the fair market value that is determined by local assessors to be the total taxable value of land and additions on the property. | Land | Improvement |
|---|---|---|---|---|
| 2024 | $1,211 | $54,500 | $6,800 | $47,700 |
| 2023 | $1,116 | $49,900 | $6,400 | $43,500 |
| 2022 | $1,130 | $50,500 | $6,100 | $44,400 |
| 2021 | $952 | $42,300 | $6,000 | $36,300 |
| 2020 | $913 | $40,400 | $5,700 | $34,700 |
| 2019 | $893 | $39,500 | $5,700 | $33,800 |
| 2018 | $838 | $36,300 | $5,700 | $30,600 |
| 2017 | $722 | $36,100 | $5,700 | $30,400 |
| 2016 | $951 | $36,100 | $5,700 | $30,400 |
| 2014 | $798 | $39,900 | $5,500 | $34,400 |
| 2013 | $798 | $39,900 | $5,500 | $34,400 |
Source: Public Records
Map
Nearby Homes