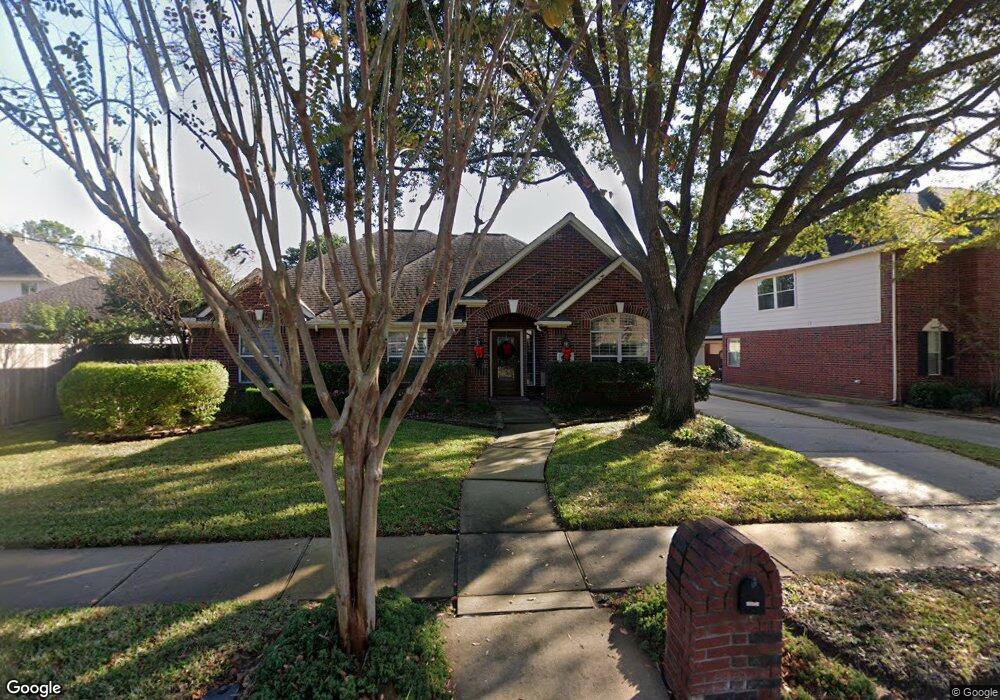
16222 Castlegrove Ct Tomball, TX 77377
Estimated Value: $338,000 - $362,000
2
Beds
2
Baths
1,964
Sq Ft
$180/Sq Ft
Est. Value
About This Home
This home is located at 16222 Castlegrove Ct, Tomball, TX 77377 and is currently estimated at $353,109, approximately $179 per square foot. 16222 Castlegrove Ct is a home located in Harris County with nearby schools including Lakewood Elementary School, Willow Wood Junior High School, and Northpointe Intermediate School.
Ownership History
Date
Name
Owned For
Owner Type
Purchase Details
Closed on
Oct 21, 2013
Sold by
Carmody Kevin J
Bought by
Roark Lisa B and Roark Terry G
Current Estimated Value
Home Financials for this Owner
Home Financials are based on the most recent Mortgage that was taken out on this home.
Original Mortgage
$181,550
Outstanding Balance
$137,369
Interest Rate
4.68%
Mortgage Type
FHA
Estimated Equity
$215,740
Purchase Details
Closed on
Dec 22, 2000
Sold by
David Powers Homes Wo Ltd
Bought by
Carmody Kevin J
Home Financials for this Owner
Home Financials are based on the most recent Mortgage that was taken out on this home.
Original Mortgage
$138,950
Interest Rate
7.73%
Purchase Details
Closed on
Dec 21, 2000
Sold by
Great America Companies Inc
Bought by
David Powers Homes Wo Ltd
Home Financials for this Owner
Home Financials are based on the most recent Mortgage that was taken out on this home.
Original Mortgage
$138,950
Interest Rate
7.73%
Create a Home Valuation Report for This Property
The Home Valuation Report is an in-depth analysis detailing your home's value as well as a comparison with similar homes in the area
Home Values in the Area
Average Home Value in this Area
Purchase History
| Date | Buyer | Sale Price | Title Company |
|---|---|---|---|
| Roark Lisa B | -- | Stewart Title | |
| Carmody Kevin J | -- | Stewart Title | |
| David Powers Homes Wo Ltd | -- | Stewart Title |
Source: Public Records
Mortgage History
| Date | Status | Borrower | Loan Amount |
|---|---|---|---|
| Open | Roark Lisa B | $181,550 | |
| Previous Owner | Carmody Kevin J | $138,950 | |
| Closed | Carmody Kevin J | $17,373 |
Source: Public Records
Tax History Compared to Growth
Tax History
| Year | Tax Paid | Tax Assessment Tax Assessment Total Assessment is a certain percentage of the fair market value that is determined by local assessors to be the total taxable value of land and additions on the property. | Land | Improvement |
|---|---|---|---|---|
| 2025 | $5,480 | $355,000 | $72,173 | $282,827 |
| 2024 | $5,480 | $335,852 | $69,257 | $266,595 |
| 2023 | $5,480 | $350,390 | $62,331 | $288,059 |
| 2022 | $6,303 | $318,314 | $62,331 | $255,983 |
| 2021 | $6,490 | $260,887 | $43,741 | $217,146 |
| 2020 | $5,624 | $217,214 | $43,741 | $173,473 |
| 2019 | $5,461 | $205,368 | $41,919 | $163,449 |
| 2018 | $2,401 | $204,168 | $31,753 | $172,415 |
| 2017 | $5,139 | $204,168 | $31,753 | $172,415 |
| 2016 | $4,672 | $204,168 | $31,753 | $172,415 |
| 2015 | $3,776 | $160,000 | $31,753 | $128,247 |
| 2014 | $3,776 | $160,000 | $31,753 | $128,247 |
Source: Public Records
Map
Nearby Homes
- 11814 Lake Grove Ct
- 16855 E Maglitto Cir
- 11611 Teal Hollow Ln
- 16218 Jordyn Lake Dr
- 11650 Brentcross Dr
- 15903 Heron Trail
- 15915 Broad Oak Ct
- 11831 Gray Forest Trail
- 16206 Lakewood Field Dr
- 16106 Limestone Lake Dr
- 15726 Gettysburg Dr
- 11815 Lakewood Hills Dr
- 16107 Sweetwater Fields Ln Unit B1
- 17311 Elverson Oaks Dr
- 16030 Summerville Lake Dr
- 16102 Buckhead Ct
- 11722 Gray Forest Trail
- 16012 Summerville Lake Dr
- 11802 Laurel Meadow Dr
- 11719 Lakewood Crossing Dr
- 16218 Castlegrove Ct
- 11735 Briar Canyon Ct
- 11731 Briar Canyon Ct
- 11722 Moccasin Ct
- 16214 Castlegrove Ct
- 11718 Moccasin Ct
- 11727 Briar Canyon Ct
- 16223 Castlegrove Ct
- 16227 Castlegrove Ct
- 16210 Castlegrove Ct
- 16219 Castlegrove Ct
- 11723 Briar Canyon Ct
- 11723 Moccasin Ct
- 16215 Castlegrove Ct
- 11714 Moccasin Ct
- 16231 Castlegrove Ct
- 11730 Briar Canyon Ct
- 16206 Castlegrove Ct
- 11719 Briar Canyon Ct
- 11734 Briar Canyon Ct