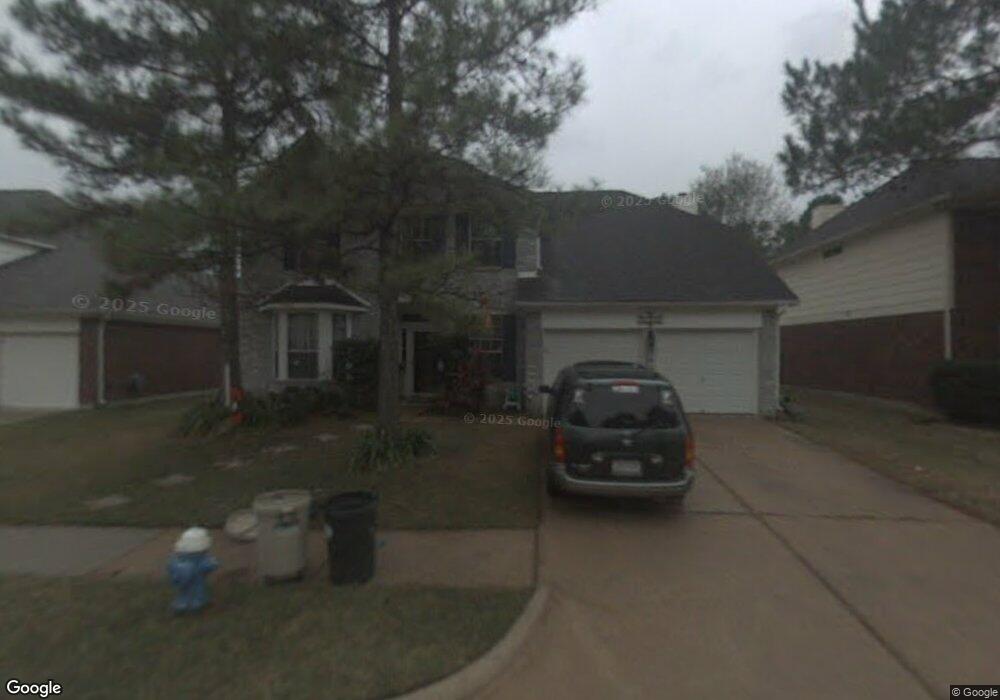
16223 Kintyre Point Rd Houston, TX 77095
Copperfield NeighborhoodEstimated Value: $300,128 - $332,000
4
Beds
3
Baths
2,494
Sq Ft
$128/Sq Ft
Est. Value
About This Home
This home is located at 16223 Kintyre Point Rd, Houston, TX 77095 and is currently estimated at $318,532, approximately $127 per square foot. 16223 Kintyre Point Rd is a home located in Harris County with nearby schools including Lowery Elementary School, Aragon Middle School, and Langham Creek High School.
Ownership History
Date
Name
Owned For
Owner Type
Purchase Details
Closed on
Aug 30, 2005
Sold by
Coker Shana C and Coker Terry A
Bought by
Newport Johnny E and Newport Julia W
Current Estimated Value
Home Financials for this Owner
Home Financials are based on the most recent Mortgage that was taken out on this home.
Original Mortgage
$131,400
Outstanding Balance
$70,078
Interest Rate
5.8%
Mortgage Type
Fannie Mae Freddie Mac
Estimated Equity
$248,454
Purchase Details
Closed on
Aug 10, 2001
Sold by
Laney Daniel H and Laney Kim W
Bought by
Coker Shana C and Coker Terry A
Home Financials for this Owner
Home Financials are based on the most recent Mortgage that was taken out on this home.
Original Mortgage
$119,850
Interest Rate
7.14%
Purchase Details
Closed on
Dec 1, 1994
Sold by
Hoover A Daniel and Hoover Norma K
Bought by
Laney Daniel H and Laney Kim W
Home Financials for this Owner
Home Financials are based on the most recent Mortgage that was taken out on this home.
Original Mortgage
$103,550
Interest Rate
8.99%
Create a Home Valuation Report for This Property
The Home Valuation Report is an in-depth analysis detailing your home's value as well as a comparison with similar homes in the area
Home Values in the Area
Average Home Value in this Area
Purchase History
| Date | Buyer | Sale Price | Title Company |
|---|---|---|---|
| Newport Johnny E | -- | American Title Co | |
| Coker Shana C | -- | American Title Co | |
| Laney Daniel H | -- | Stewart Title |
Source: Public Records
Mortgage History
| Date | Status | Borrower | Loan Amount |
|---|---|---|---|
| Open | Newport Johnny E | $131,400 | |
| Previous Owner | Coker Shana C | $119,850 | |
| Previous Owner | Laney Daniel H | $103,550 |
Source: Public Records
Tax History Compared to Growth
Tax History
| Year | Tax Paid | Tax Assessment Tax Assessment Total Assessment is a certain percentage of the fair market value that is determined by local assessors to be the total taxable value of land and additions on the property. | Land | Improvement |
|---|---|---|---|---|
| 2025 | $2,803 | $296,602 | $63,554 | $233,048 |
| 2024 | $2,803 | $294,348 | $57,658 | $236,690 |
| 2023 | $2,803 | $333,012 | $57,658 | $275,354 |
| 2022 | $6,982 | $284,813 | $41,278 | $243,535 |
| 2021 | $6,715 | $233,094 | $41,278 | $191,816 |
| 2020 | $6,822 | $225,563 | $34,726 | $190,837 |
| 2019 | $6,549 | $210,882 | $34,726 | $176,156 |
| 2018 | $1,999 | $204,804 | $34,726 | $170,078 |
| 2017 | $6,485 | $204,804 | $34,726 | $170,078 |
| 2016 | $6,178 | $195,204 | $34,726 | $160,478 |
| 2015 | $3,909 | $195,204 | $34,726 | $160,478 |
| 2014 | $3,909 | $162,417 | $27,846 | $134,571 |
Source: Public Records
Map
Nearby Homes
- 16215 Cairngorm Ave
- 16215 Wemyss Bay Rd
- 16319 Chimneystone Dr
- 16315 Battlecreek Dr
- 16114 Kintyre Point Rd
- 16026 Autumn Falls Ln
- 16030 Royal Garden Dr
- 16510 Wellers Way
- 7622 Mccormick Mill Ct
- 7614 Mccormick Mill Ct
- 16535 Oat Mill Dr
- 7719 Woodlett Ct
- 16335 Drystone Ln
- 16502 Rainbow Lake Rd
- 15918 Pinyon Creek Dr
- 8426 Laurel Trails Dr
- 15854 Knolls Lodge Dr
- 16514 Innisbrook Dr
- 16606 Stoneside Dr
- 8526 Hot Springs Dr
- 16227 Kintyre Point Rd
- 16219 Kintyre Point Rd
- 16215 Kintyre Point Rd
- 16231 Kintyre Point Rd
- 16222 Kintyre Point Rd
- 16218 Kintyre Point Rd
- 16226 Kintyre Point Rd
- 16211 Kintyre Point Rd
- 16214 Kintyre Point Rd
- 16235 Kintyre Point Rd
- 16210 Kintyre Point Rd
- 7803 Braemar Crescent St
- 7803 Braemar Cresent St
- 16207 Kintyre Point Rd
- 16219 Cairngorm Ave
- 16223 Cairngorm Ave
- 7807 Braemar Crescent St
- 7807 Braemar Cresent St
- 16206 Kintyre Point Rd
- 16211 Cairngorm Ave