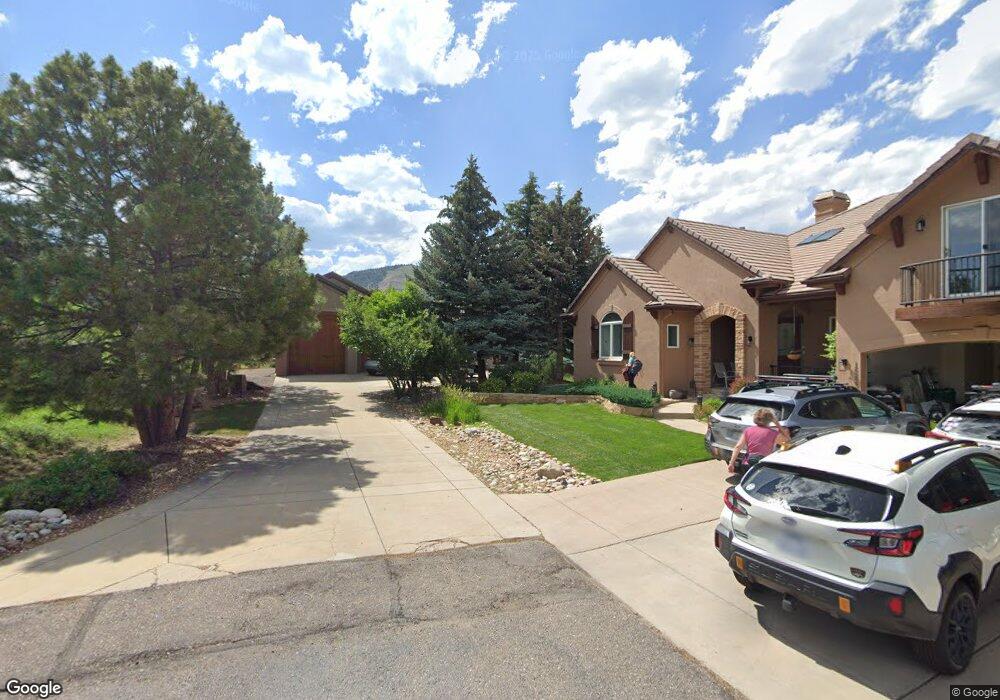
16224 Red Deer Ct Morrison, CO 80465
Willow Springs NeighborhoodEstimated Value: $1,688,201 - $2,247,000
4
Beds
5
Baths
5,792
Sq Ft
$325/Sq Ft
Est. Value
About This Home
This home is located at 16224 Red Deer Ct, Morrison, CO 80465 and is currently estimated at $1,881,550, approximately $324 per square foot. 16224 Red Deer Ct is a home located in Jefferson County with nearby schools including Red Rocks Elementary School, Carmody Middle School, and Bear Creek High School.
Ownership History
Date
Name
Owned For
Owner Type
Purchase Details
Closed on
Jul 14, 2023
Sold by
Manning Charles B and Manning Mary Deborah
Bought by
Manning Residence Trust and Manning
Current Estimated Value
Purchase Details
Closed on
Jul 31, 2013
Sold by
Rons Family Living Trust
Bought by
Manning Charles B and Manning Mary Deborah
Purchase Details
Closed on
Sep 15, 2003
Sold by
Rons Duane J and Rons Dixie L
Bought by
Rons Family Living Trust
Home Financials for this Owner
Home Financials are based on the most recent Mortgage that was taken out on this home.
Original Mortgage
$195,000
Interest Rate
5.37%
Mortgage Type
Purchase Money Mortgage
Purchase Details
Closed on
Nov 8, 2000
Sold by
Whale Rock Country Club Inc
Bought by
Rons Family Living Trust
Purchase Details
Closed on
Mar 9, 1998
Sold by
R S Pott Inc
Bought by
Rons Family Living Trust
Create a Home Valuation Report for This Property
The Home Valuation Report is an in-depth analysis detailing your home's value as well as a comparison with similar homes in the area
Home Values in the Area
Average Home Value in this Area
Purchase History
| Date | Buyer | Sale Price | Title Company |
|---|---|---|---|
| Manning Residence Trust | -- | None Listed On Document | |
| Manning Charles B | $1,099,000 | Stewart Title | |
| Rons Family Living Trust | -- | -- | |
| Rons Duane J | -- | -- | |
| Rons Family Living Trust | -- | -- | |
| Rons Family Living Trust | $95,000 | -- | |
| R S Pott Inc | $75,000 | -- |
Source: Public Records
Mortgage History
| Date | Status | Borrower | Loan Amount |
|---|---|---|---|
| Previous Owner | Rons Duane J | $195,000 |
Source: Public Records
Tax History Compared to Growth
Tax History
| Year | Tax Paid | Tax Assessment Tax Assessment Total Assessment is a certain percentage of the fair market value that is determined by local assessors to be the total taxable value of land and additions on the property. | Land | Improvement |
|---|---|---|---|---|
| 2024 | $12,356 | $111,523 | $28,242 | $83,281 |
| 2023 | $12,356 | $111,523 | $28,242 | $83,281 |
| 2022 | $10,431 | $87,608 | $21,909 | $65,699 |
| 2021 | $10,575 | $90,129 | $22,539 | $67,590 |
| 2020 | $9,756 | $83,307 | $18,954 | $64,353 |
| 2019 | $9,659 | $83,307 | $18,954 | $64,353 |
| 2018 | $9,317 | $78,168 | $17,445 | $60,723 |
| 2017 | $8,627 | $78,168 | $17,445 | $60,723 |
| 2016 | $9,138 | $78,566 | $17,736 | $60,830 |
| 2015 | $7,945 | $78,566 | $17,736 | $60,830 |
| 2014 | $7,945 | $63,008 | $16,601 | $46,407 |
Source: Public Records
Map
Nearby Homes
- 16223 Red Deer Ct
- 16096 Double Eagle Dr Unit B
- 16324 River Haven Way
- 15906 Double Eagle Dr
- 16601 Red Cliff Cir
- 16939 Long Winding Rd
- 15789 Sandtrap Way
- 16989 Long Winding Rd
- 5569 Willow Springs Dr
- 17186 Lost Horse Ln
- 15480 Dinosaur Ridge Rd
- 15191 Dinosaur Ridge Rd
- 16066 Ridge Tee Dr
- 17106 Lost Horse Ln
- 16979 Lost Winding Rd
- 17121 Snow Creek Ln
- 4885 Noris Ave
- 4888 Noris Ave
- 14586 Mellow Ct
- 14576 Mellow Ct
- 16213 Red Deer Ct
- 15986 Red Deer Dr
- 16081 Deer Ridge Dr Unit A
- 16081 Deer Ridge Dr Unit B
- 16210 Deer Haven Ct
- 15993 Burrowing Owl Ct
- 15966 Red Deer Dr
- 16220 Deer Haven Ct
- 16200 Deer Haven Ct
- 15973 Burrowing Owl Ct
- 15983 Burrowing Owl Ct
- 16230 Deer Haven Ct
- 15946 Red Deer Dr
- 16226 Riverhaven Way
- 16224 Riverhaven Way
- 16224 River Haven Way
- 16051 Deer Ridge Dr Unit A
- 16051 Deer Ridge Dr Unit B
- 16240 Deer Haven Ct
- 15963 Burrowing Owl Ct