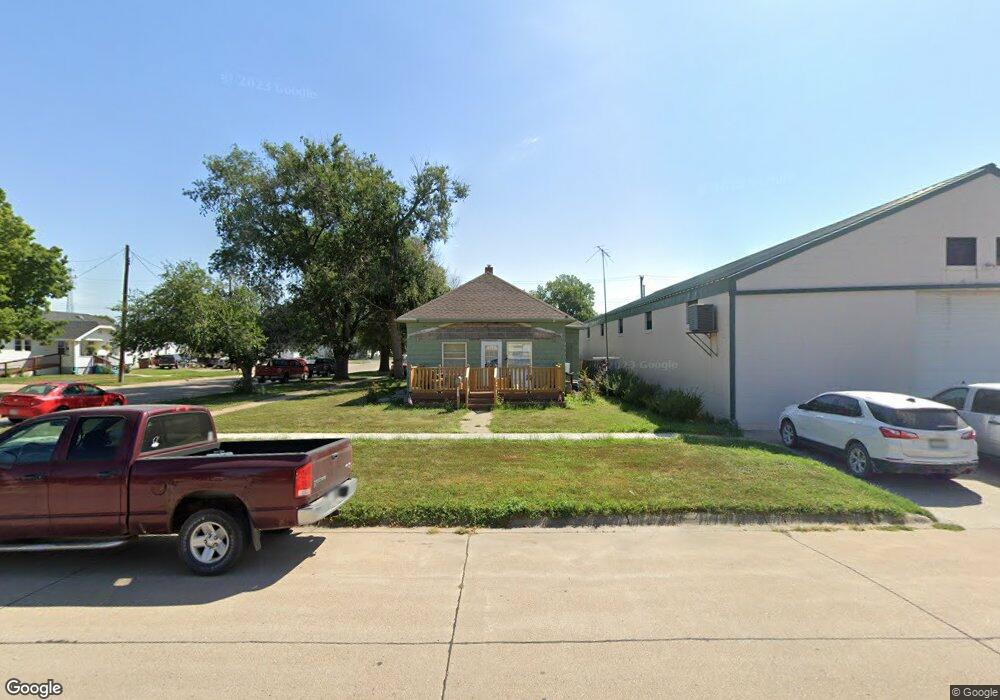
1623 1st Ave Kearney, NE 68847
Estimated Value: $123,000 - $154,163
2
Beds
1
Bath
900
Sq Ft
$146/Sq Ft
Est. Value
About This Home
This home is located at 1623 1st Ave, Kearney, NE 68847 and is currently estimated at $131,791, approximately $146 per square foot. 1623 1st Ave is a home located in Buffalo County with nearby schools including Bryant Elementary School, Sunrise Middle School, and Kearney Senior High School.
Ownership History
Date
Name
Owned For
Owner Type
Purchase Details
Closed on
Aug 10, 2014
Sold by
Jordan D Jordan D
Bought by
Neville Patrick J and Neville Michelle L
Current Estimated Value
Home Financials for this Owner
Home Financials are based on the most recent Mortgage that was taken out on this home.
Original Mortgage
$77,600
Outstanding Balance
$59,346
Interest Rate
4.19%
Mortgage Type
Purchase Money Mortgage
Estimated Equity
$72,445
Purchase Details
Closed on
Mar 30, 2011
Sold by
Aguirre Gonzalez Salvador and Aguirre Juanita
Bought by
Brummund Jordan D
Home Financials for this Owner
Home Financials are based on the most recent Mortgage that was taken out on this home.
Original Mortgage
$53,000
Interest Rate
4.92%
Purchase Details
Closed on
Nov 21, 2005
Sold by
Greene Phyllis J
Bought by
Aguirre Salvador and Aguirre Juanita M
Home Financials for this Owner
Home Financials are based on the most recent Mortgage that was taken out on this home.
Original Mortgage
$38,000
Interest Rate
6.06%
Create a Home Valuation Report for This Property
The Home Valuation Report is an in-depth analysis detailing your home's value as well as a comparison with similar homes in the area
Home Values in the Area
Average Home Value in this Area
Purchase History
| Date | Buyer | Sale Price | Title Company |
|---|---|---|---|
| Neville Patrick J | -- | Vintage Title | |
| Brummund Jordan D | $57,000 | Barney | |
| Aguirre Salvador | $40,000 | -- |
Source: Public Records
Mortgage History
| Date | Status | Borrower | Loan Amount |
|---|---|---|---|
| Open | Neville Patrick J | $77,600 | |
| Previous Owner | Brummund Jordan D | $53,000 | |
| Previous Owner | Aguirre Salvador | $38,000 |
Source: Public Records
Tax History Compared to Growth
Tax History
| Year | Tax Paid | Tax Assessment Tax Assessment Total Assessment is a certain percentage of the fair market value that is determined by local assessors to be the total taxable value of land and additions on the property. | Land | Improvement |
|---|---|---|---|---|
| 2025 | $1,200 | $94,175 | $28,980 | $65,195 |
| 2024 | $1,200 | $92,135 | $28,140 | $63,995 |
| 2023 | $1,594 | $93,675 | $28,140 | $65,535 |
| 2022 | $1,579 | $89,975 | $27,235 | $62,740 |
| 2021 | $1,890 | $109,580 | $26,215 | $83,365 |
| 2020 | $1,860 | $107,510 | $28,490 | $79,020 |
| 2019 | $1,753 | $100,140 | $28,840 | $71,300 |
| 2018 | $1,528 | $88,510 | $28,840 | $59,670 |
| 2017 | $1,338 | $78,010 | $28,840 | $49,170 |
| 2016 | $1,327 | $78,010 | $28,840 | $49,170 |
| 2015 | $1,616 | $92,925 | $0 | $0 |
| 2014 | $1,115 | $58,485 | $0 | $0 |
Source: Public Records
Map
Nearby Homes