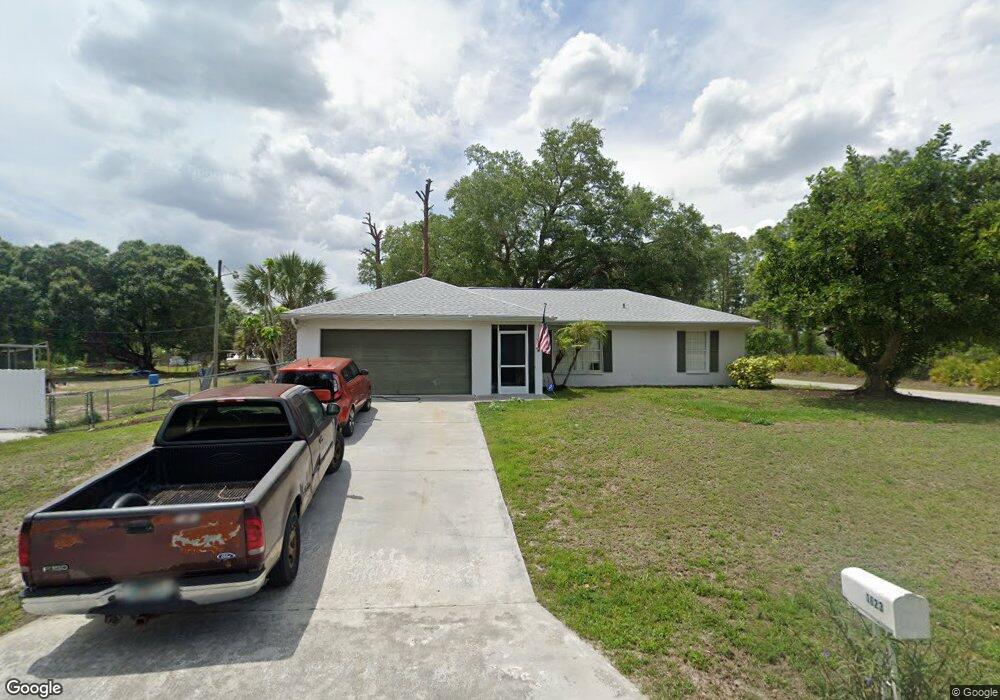
1623 Clark Ave Unit 3 Lehigh Acres, FL 33972
Richmond NeighborhoodEstimated Value: $205,000 - $271,000
3
Beds
2
Baths
1,196
Sq Ft
$204/Sq Ft
Est. Value
About This Home
This home is located at 1623 Clark Ave Unit 3, Lehigh Acres, FL 33972 and is currently estimated at $244,479, approximately $204 per square foot. 1623 Clark Ave Unit 3 is a home located in Lee County with nearby schools including Lehigh Elementary School, The Alva School, and Gateway Elementary School.
Ownership History
Date
Name
Owned For
Owner Type
Purchase Details
Closed on
Oct 23, 2020
Sold by
Tyler Brandon
Bought by
Rios Vidal
Current Estimated Value
Home Financials for this Owner
Home Financials are based on the most recent Mortgage that was taken out on this home.
Original Mortgage
$152,192
Outstanding Balance
$135,120
Interest Rate
2.8%
Mortgage Type
FHA
Estimated Equity
$109,359
Purchase Details
Closed on
Jun 26, 2006
Sold by
Campbell Robert
Bought by
Tyler Brandon
Home Financials for this Owner
Home Financials are based on the most recent Mortgage that was taken out on this home.
Original Mortgage
$39,000
Interest Rate
6.57%
Mortgage Type
Stand Alone Second
Purchase Details
Closed on
Dec 12, 2005
Sold by
Skala Thomas M and Skala Karen J
Bought by
Campbell Robert
Home Financials for this Owner
Home Financials are based on the most recent Mortgage that was taken out on this home.
Original Mortgage
$157,590
Interest Rate
7.5%
Mortgage Type
Fannie Mae Freddie Mac
Create a Home Valuation Report for This Property
The Home Valuation Report is an in-depth analysis detailing your home's value as well as a comparison with similar homes in the area
Home Values in the Area
Average Home Value in this Area
Purchase History
| Date | Buyer | Sale Price | Title Company |
|---|---|---|---|
| Rios Vidal | $155,000 | Townsend Title | |
| Tyler Brandon | $195,000 | Lee Title Services Inc | |
| Campbell Robert | $175,100 | Lee Title Services Inc |
Source: Public Records
Mortgage History
| Date | Status | Borrower | Loan Amount |
|---|---|---|---|
| Open | Rios Vidal | $152,192 | |
| Previous Owner | Tyler Brandon | $39,000 | |
| Previous Owner | Campbell Robert | $157,590 |
Source: Public Records
Tax History Compared to Growth
Tax History
| Year | Tax Paid | Tax Assessment Tax Assessment Total Assessment is a certain percentage of the fair market value that is determined by local assessors to be the total taxable value of land and additions on the property. | Land | Improvement |
|---|---|---|---|---|
| 2025 | $1,680 | $121,056 | -- | -- |
| 2024 | $1,680 | $117,644 | -- | -- |
| 2023 | $1,598 | $114,217 | $0 | $0 |
| 2022 | $1,502 | $110,890 | $0 | $0 |
| 2021 | $1,425 | $107,660 | $5,520 | $102,140 |
| 2020 | $1,672 | $100,133 | $3,300 | $96,833 |
| 2019 | $1,689 | $96,093 | $3,300 | $92,793 |
| 2018 | $1,587 | $87,215 | $3,150 | $84,065 |
| 2017 | $1,517 | $83,976 | $3,050 | $80,926 |
| 2016 | $1,382 | $70,235 | $4,107 | $66,128 |
| 2015 | $1,265 | $58,596 | $3,092 | $55,504 |
| 2014 | -- | $52,904 | $2,889 | $50,015 |
| 2013 | -- | $45,107 | $2,702 | $42,405 |
Source: Public Records
Map
Nearby Homes
- 1615 Congress Ave
- 1503 W 17th St
- 1608 Congress Ave
- 1613 Congress Ave
- 1703 Congress Ave
- 1620 State Ave
- 1621 State Ave
- 1600 Acacia Ave
- 1620 Euclid Ave Unit 2
- 1702 Euclid Ave
- 1606 Euclid Ave
- 1713 State Ave
- 1606 W 16th St Unit 12 W1/2
- 1703 W 17th St
- 203 W 17th St
- 605 W 17th St
- 1905 W 17th St
- 1305 W 17th St
- 1102 W 16th St
- 1717 Williams Ave
- 1403 W 17th St
- 1621 Clark Ave
- 1619 Clark Ave
- 1306 W 17th St
- 1620 Congress Ave
- 1304 W 17th St Unit 4
- 1407 W 17th St
- 1406 W 17th St
- 1702 Congress Ave
- 1616 Clark Ave
- 1616 Congress Ave
- 1621 Acacia Ave
- 1701 Acacia Ave
- 1619 Acacia Ave
- 1703 Acacia Ave Unit 4
- 1617 Acacia Ave
- 1621 Congress Ave
- 1705 Acacia Ave
- 1619 Congress Ave
- 1703 Congress Ave Unit 12