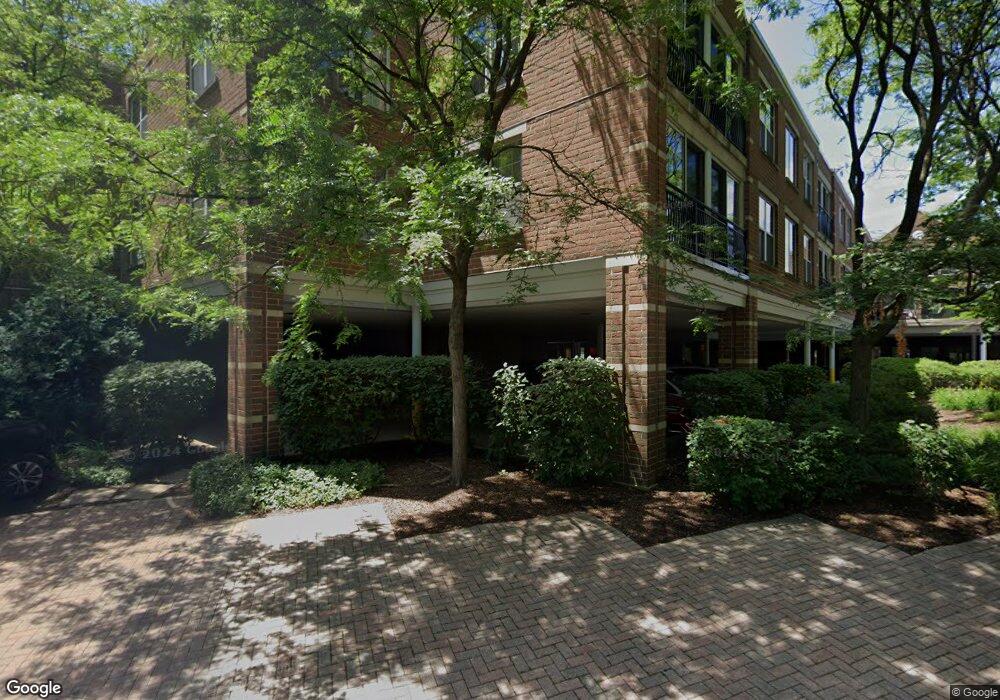
1623 Glenview Rd Unit 217 Glenview, IL 60025
Estimated Value: $303,000 - $459,000
2
Beds
--
Bath
157,888
Sq Ft
$3/Sq Ft
Est. Value
About This Home
This home is located at 1623 Glenview Rd Unit 217, Glenview, IL 60025 and is currently estimated at $402,738, approximately $2 per square foot. 1623 Glenview Rd Unit 217 is a home located in Cook County with nearby schools including Lyon Elementary School, Pleasant Ridge Elementary School, and Springman Middle School.
Ownership History
Date
Name
Owned For
Owner Type
Purchase Details
Closed on
Dec 8, 2018
Sold by
Goldman Steven H and Goldman Madeline S
Bought by
Goldman Steven H and Goldman Madeline
Current Estimated Value
Purchase Details
Closed on
Sep 2, 2006
Sold by
Castle Robert
Bought by
Goldman Steven H and Goldman Madeline S
Home Financials for this Owner
Home Financials are based on the most recent Mortgage that was taken out on this home.
Original Mortgage
$210,000
Outstanding Balance
$121,448
Interest Rate
6%
Mortgage Type
Purchase Money Mortgage
Estimated Equity
$281,290
Purchase Details
Closed on
Feb 8, 2001
Sold by
Lasalle Bank National Assn
Bought by
Castle Robert
Create a Home Valuation Report for This Property
The Home Valuation Report is an in-depth analysis detailing your home's value as well as a comparison with similar homes in the area
Home Values in the Area
Average Home Value in this Area
Purchase History
| Date | Buyer | Sale Price | Title Company |
|---|---|---|---|
| Goldman Steven H | -- | Fidelity National Title | |
| Goldman Steven H | $495,000 | Republic Title Company | |
| Castle Robert | $356,500 | -- |
Source: Public Records
Mortgage History
| Date | Status | Borrower | Loan Amount |
|---|---|---|---|
| Open | Goldman Steven H | $210,000 |
Source: Public Records
Tax History Compared to Growth
Tax History
| Year | Tax Paid | Tax Assessment Tax Assessment Total Assessment is a certain percentage of the fair market value that is determined by local assessors to be the total taxable value of land and additions on the property. | Land | Improvement |
|---|---|---|---|---|
| 2024 | $5,428 | $30,493 | $2,479 | $28,014 |
| 2023 | $5,234 | $30,493 | $2,479 | $28,014 |
| 2022 | $5,234 | $30,493 | $2,479 | $28,014 |
| 2021 | $4,925 | $25,784 | $1,859 | $23,925 |
| 2020 | $4,968 | $25,784 | $1,859 | $23,925 |
| 2019 | $4,622 | $28,330 | $1,859 | $26,471 |
| 2018 | $5,445 | $29,860 | $1,627 | $28,233 |
| 2017 | $5,324 | $29,860 | $1,627 | $28,233 |
| 2016 | $5,411 | $29,860 | $1,627 | $28,233 |
| 2015 | $4,650 | $24,023 | $1,317 | $22,706 |
| 2014 | $4,587 | $24,023 | $1,317 | $22,706 |
| 2013 | $4,849 | $24,023 | $1,317 | $22,706 |
Source: Public Records
Map
Nearby Homes
- 1800 Dewes St Unit 305
- 1800 Dewes St Unit 201
- 713 Carriage Hill Dr
- 711 Carriage Hill Dr
- 1752 Maclean Ct
- 609 Carriage Hill Dr
- 601 Carriage Hill Dr
- 1220 Depot St Unit 305
- 1220 Depot St Unit 109
- 1220 Depot St Unit 409
- 1342 Pine St
- 1341 Greenwillow Ln Unit C
- 1821 George Ct
- 1123 Longvalley Rd
- 1121 Longvalley Rd
- 1429 Pebblecreek Dr Unit 171
- 809 Lenox Rd
- 2137 Glenview Rd
- 1508 Pebblecreek Dr Unit 14
- 1623 Glenview Rd Unit 326
- 1623 Glenview Rd Unit 311
- 1623 Glenview Rd Unit 322
- 1623 Glenview Rd Unit 224
- 1623 Glenview Rd Unit 221
- 1623 Glenview Rd Unit 220
- 1623 Glenview Rd Unit 316
- 1623 Glenview Rd Unit 222
- 1623 Glenview Rd Unit 219
- 1623 Glenview Rd Unit 329
- 1623 Glenview Rd Unit 225
- 1623 Glenview Rd Unit 218
- 1623 Glenview Rd Unit 320
- 1623 Glenview Rd Unit 228
- 1623 Glenview Rd Unit 328
- 1623 Glenview Rd Unit 324
- 1623 Glenview Rd Unit 227
- 1623 Glenview Rd Unit 223
- 1623 Glenview Rd Unit 318
- 1623 Glenview Rd Unit 216