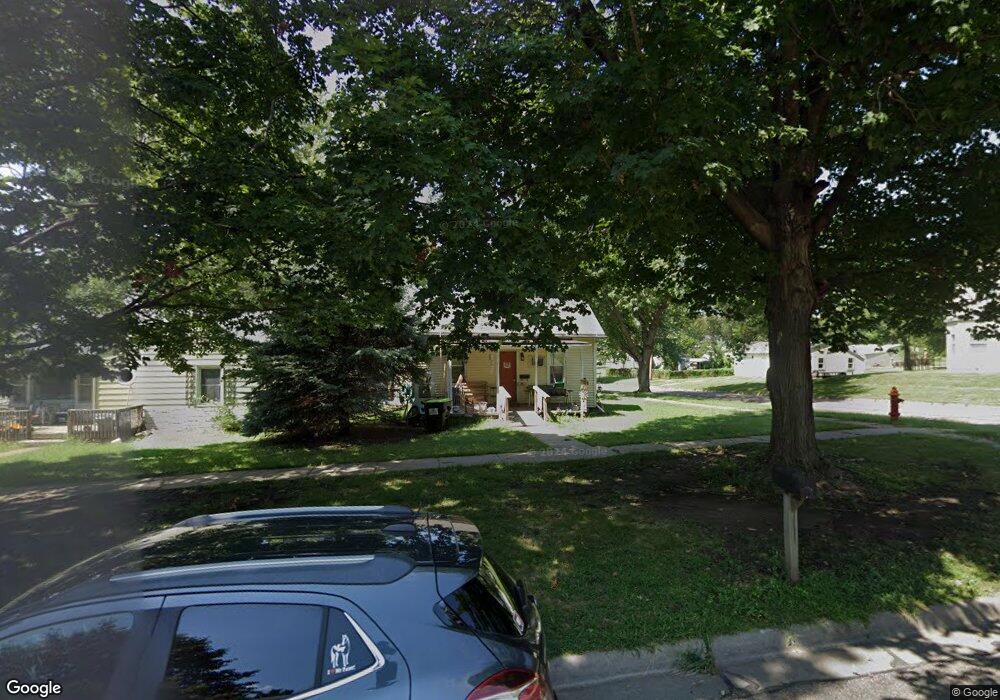
1623 Mclean St Falls City, NE 68355
Estimated Value: $53,000 - $72,000
2
Beds
1
Bath
816
Sq Ft
$75/Sq Ft
Est. Value
About This Home
This home is located at 1623 Mclean St, Falls City, NE 68355 and is currently estimated at $60,909, approximately $74 per square foot. 1623 Mclean St is a home located in Richardson County with nearby schools including Falls City North Elementary School, Falls City South Elementary School, and Falls City Middle School.
Ownership History
Date
Name
Owned For
Owner Type
Purchase Details
Closed on
Jun 26, 2024
Sold by
Croft James W
Bought by
Hamilton Robert J and Hamilton Chelsea E
Current Estimated Value
Purchase Details
Closed on
Dec 3, 2009
Sold by
Wisdom Jr Vernon M
Bought by
Dewald William O and Dewald Lina C
Purchase Details
Closed on
Dec 1, 2009
Sold by
Wisdom Vernon M and Wisdom Ranae A
Bought by
Dewald William O and Dewald Lina C
Purchase Details
Closed on
Nov 30, 2004
Sold by
Sanders Joan
Bought by
Wisdom Jr Vernon M
Create a Home Valuation Report for This Property
The Home Valuation Report is an in-depth analysis detailing your home's value as well as a comparison with similar homes in the area
Home Values in the Area
Average Home Value in this Area
Purchase History
| Date | Buyer | Sale Price | Title Company |
|---|---|---|---|
| Hamilton Robert J | $28,100 | -- | |
| Dewald William O | $8,300 | -- | |
| Dewald William O | -- | -- | |
| Wisdom Jr Vernon M | $11,250 | -- |
Source: Public Records
Tax History Compared to Growth
Tax History
| Year | Tax Paid | Tax Assessment Tax Assessment Total Assessment is a certain percentage of the fair market value that is determined by local assessors to be the total taxable value of land and additions on the property. | Land | Improvement |
|---|---|---|---|---|
| 2025 | $399 | $31,854 | $3,600 | $28,254 |
| 2024 | $399 | $30,255 | $3,600 | $26,655 |
| 2023 | $216 | $13,172 | $3,600 | $9,572 |
| 2022 | $208 | $10,855 | $1,620 | $9,235 |
| 2021 | $206 | $10,971 | $1,620 | $9,351 |
| 2020 | $199 | $10,526 | $1,620 | $8,906 |
| 2019 | $198 | $10,267 | $1,620 | $8,647 |
| 2018 | $195 | $10,015 | $1,620 | $8,395 |
| 2017 | $195 | $10,015 | $1,620 | $8,395 |
| 2016 | $189 | $9,770 | $1,620 | $8,150 |
| 2015 | $190 | $9,770 | $1,620 | $8,150 |
| 2014 | $190 | $9,770 | $1,620 | $8,150 |
Source: Public Records
Map
Nearby Homes