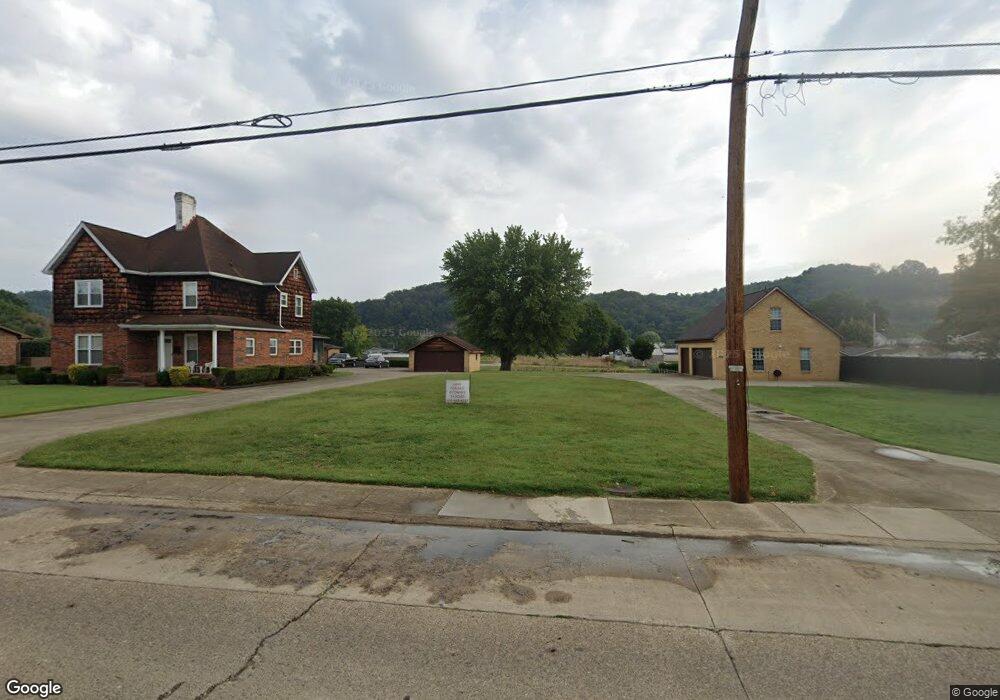
1623 N 2nd St Ironton, OH 45638
Estimated Value: $193,000 - $268,000
4
Beds
1
Bath
2,004
Sq Ft
$112/Sq Ft
Est. Value
About This Home
This home is located at 1623 N 2nd St, Ironton, OH 45638 and is currently estimated at $223,795, approximately $111 per square foot. 1623 N 2nd St is a home located in Lawrence County with nearby schools including Ironton Elementary School, Ironton Middle School, and Ironton High School.
Ownership History
Date
Name
Owned For
Owner Type
Purchase Details
Closed on
Sep 11, 2020
Sold by
Crowe William M and Crowe Deanna Ruth
Bought by
Bowman Jim L and Bowman Jo Ellen
Current Estimated Value
Purchase Details
Closed on
Jan 1, 1987
Bought by
Crowe William M and Crowe Dea
Create a Home Valuation Report for This Property
The Home Valuation Report is an in-depth analysis detailing your home's value as well as a comparison with similar homes in the area
Home Values in the Area
Average Home Value in this Area
Purchase History
| Date | Buyer | Sale Price | Title Company |
|---|---|---|---|
| Bowman Jim L | $175,000 | None Available | |
| Crowe William M | -- | -- |
Source: Public Records
Tax History Compared to Growth
Tax History
| Year | Tax Paid | Tax Assessment Tax Assessment Total Assessment is a certain percentage of the fair market value that is determined by local assessors to be the total taxable value of land and additions on the property. | Land | Improvement |
|---|---|---|---|---|
| 2024 | -- | $24,350 | $18,250 | $6,100 |
| 2023 | $1,939 | $24,350 | $18,250 | $6,100 |
| 2022 | $1,938 | $54,050 | $18,250 | $35,800 |
| 2021 | $1,707 | $45,400 | $15,210 | $30,190 |
| 2020 | $1,722 | $45,400 | $15,210 | $30,190 |
| 2019 | $1,716 | $45,400 | $15,210 | $30,190 |
| 2018 | $1,735 | $45,400 | $15,210 | $30,190 |
| 2017 | $1,731 | $45,400 | $15,210 | $30,190 |
| 2016 | $1,626 | $45,400 | $15,210 | $30,190 |
| 2015 | $1,493 | $40,220 | $15,240 | $24,980 |
| 2014 | $1,441 | $40,220 | $15,240 | $24,980 |
| 2013 | $1,437 | $40,220 | $15,240 | $24,980 |
Source: Public Records
Map
Nearby Homes