Estimated Value: $124,000 - $183,000
4
Beds
2
Baths
2,793
Sq Ft
$58/Sq Ft
Est. Value
About This Home
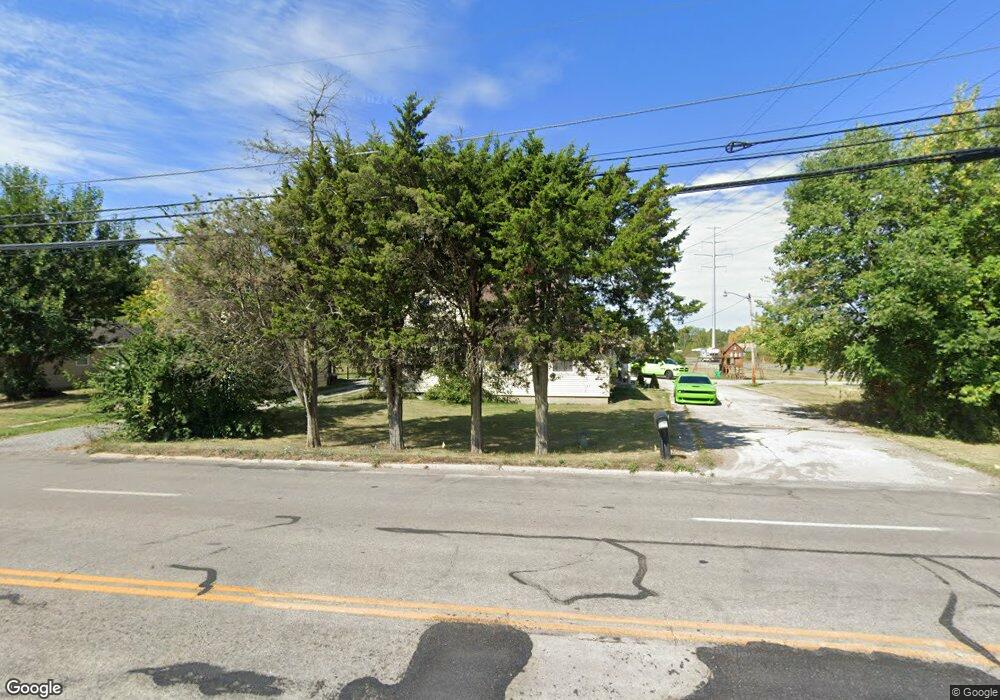
This home is located at 1623 N Sugar St, Lima, OH 45801 and is currently estimated at $162,324, approximately $58 per square foot. 1623 N Sugar St is a home located in Allen County with nearby schools including Bath Elementary School, Bath Middle School, and Bath High School.
Ownership History
Date
Name
Owned For
Owner Type
Purchase Details
Closed on
Dec 9, 2021
Bought by
Brett A Good
Current Estimated Value
Purchase Details
Closed on
Dec 15, 2006
Sold by
Homesales Inc
Bought by
Good Brett A and Good Angie
Home Financials for this Owner
Home Financials are based on the most recent Mortgage that was taken out on this home.
Original Mortgage
$60,361
Interest Rate
6.24%
Mortgage Type
Future Advance Clause Open End Mortgage
Purchase Details
Closed on
Jan 1, 1990
Bought by
Gettman Mary L
Create a Home Valuation Report for This Property
The Home Valuation Report is an in-depth analysis detailing your home's value as well as a comparison with similar homes in the area
Home Values in the Area
Average Home Value in this Area
Purchase History
| Date | Buyer | Sale Price | Title Company |
|---|---|---|---|
| Brett A Good | -- | -- | |
| Good Brett A | $48,000 | None Available | |
| Gettman Mary L | -- | -- |
Source: Public Records
Mortgage History
| Date | Status | Borrower | Loan Amount |
|---|---|---|---|
| Previous Owner | Good Brett A | $60,361 |
Source: Public Records
Tax History Compared to Growth
Tax History
| Year | Tax Paid | Tax Assessment Tax Assessment Total Assessment is a certain percentage of the fair market value that is determined by local assessors to be the total taxable value of land and additions on the property. | Land | Improvement |
|---|---|---|---|---|
| 2024 | $1,783 | $40,320 | $2,870 | $37,450 |
| 2023 | $1,741 | $38,400 | $2,730 | $35,670 |
| 2022 | $1,750 | $38,400 | $2,730 | $35,670 |
| 2021 | $1,815 | $38,400 | $2,730 | $35,670 |
| 2020 | $1,596 | $30,490 | $2,590 | $27,900 |
| 2019 | $1,596 | $30,490 | $2,590 | $27,900 |
| 2018 | $1,558 | $30,490 | $2,590 | $27,900 |
| 2017 | $1,427 | $27,720 | $2,590 | $25,130 |
| 2016 | $1,384 | $27,720 | $2,590 | $25,130 |
| 2015 | $1,278 | $27,720 | $2,590 | $25,130 |
| 2014 | $1,278 | $24,540 | $2,590 | $21,950 |
| 2013 | $1,279 | $24,540 | $2,590 | $21,950 |
Source: Public Records
Map
Nearby Homes
- 711 Taylor Ave
- 1503 Findlay Rd Unit Lot 6
- 128 E Lane Ave
- 1200 N Main St
- 105 Watt Ave
- 123 Flanders Ave
- 340 W Robb Ave
- 400 W Northern Ave
- 410 W Northern Ave
- 622 N Jefferson St
- 939 N West St
- 439 E Mckibben St
- 222 W Grand Ave
- 735 N Main St
- 610 W Robb Ave
- 616 N Elizabeth St
- 608 W O'Connor Ave
- 1776 Virginia Ave
- 2370 N McDonel St
- 606 N West St