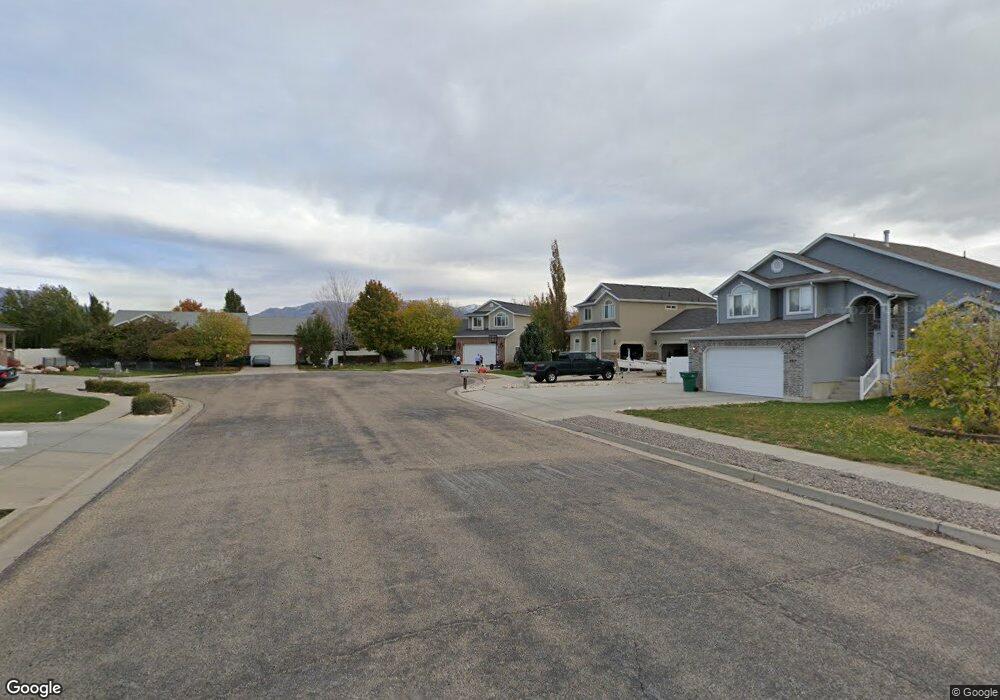
1623 W 475 N Clearfield, UT 84015
Estimated Value: $546,000 - $606,000
3
Beds
3
Baths
2,874
Sq Ft
$203/Sq Ft
Est. Value
About This Home
This home is located at 1623 W 475 N, Clearfield, UT 84015 and is currently estimated at $583,923, approximately $203 per square foot. 1623 W 475 N is a home located in Davis County with nearby schools including Lakeside School, West Point Junior High School, and Syracuse High School.
Ownership History
Date
Name
Owned For
Owner Type
Purchase Details
Closed on
Jun 3, 2005
Sold by
Welbuilt Enterprises Inc
Bought by
Stelts Jon C and Stelts Sung Hee
Current Estimated Value
Home Financials for this Owner
Home Financials are based on the most recent Mortgage that was taken out on this home.
Original Mortgage
$153,280
Outstanding Balance
$78,168
Interest Rate
5.5%
Mortgage Type
Fannie Mae Freddie Mac
Estimated Equity
$505,755
Purchase Details
Closed on
Jul 27, 2004
Sold by
M & D Developers Llc
Bought by
Welbuilt Enterprises Inc
Home Financials for this Owner
Home Financials are based on the most recent Mortgage that was taken out on this home.
Original Mortgage
$145,633
Interest Rate
6.29%
Mortgage Type
Purchase Money Mortgage
Purchase Details
Closed on
Jul 15, 2004
Sold by
Frost Curtiss L and Frost Jeriann
Bought by
M & D Developers Llc
Home Financials for this Owner
Home Financials are based on the most recent Mortgage that was taken out on this home.
Original Mortgage
$145,633
Interest Rate
6.29%
Mortgage Type
Purchase Money Mortgage
Create a Home Valuation Report for This Property
The Home Valuation Report is an in-depth analysis detailing your home's value as well as a comparison with similar homes in the area
Home Values in the Area
Average Home Value in this Area
Purchase History
| Date | Buyer | Sale Price | Title Company |
|---|---|---|---|
| Stelts Jon C | -- | Mountain View Title & Escrow | |
| Welbuilt Enterprises Inc | -- | Heritage West Title Ins | |
| M & D Developers Llc | -- | Heritage West Title Ins | |
| M & D Developers Llc | -- | Heritage West Title Insuranc |
Source: Public Records
Mortgage History
| Date | Status | Borrower | Loan Amount |
|---|---|---|---|
| Open | Stelts Jon C | $153,280 | |
| Previous Owner | Welbuilt Enterprises Inc | $145,633 |
Source: Public Records
Tax History Compared to Growth
Tax History
| Year | Tax Paid | Tax Assessment Tax Assessment Total Assessment is a certain percentage of the fair market value that is determined by local assessors to be the total taxable value of land and additions on the property. | Land | Improvement |
|---|---|---|---|---|
| 2025 | $3,398 | $318,451 | $103,516 | $214,935 |
| 2024 | $3,313 | $311,850 | $93,240 | $218,610 |
| 2023 | $3,055 | $529,000 | $113,465 | $415,535 |
| 2022 | $3,435 | $325,600 | $58,265 | $267,335 |
| 2021 | $3,026 | $429,000 | $93,992 | $335,008 |
| 2020 | $2,630 | $368,000 | $78,416 | $289,584 |
| 2019 | $2,573 | $355,000 | $76,241 | $278,759 |
| 2018 | $2,360 | $321,000 | $77,449 | $243,551 |
| 2016 | $2,070 | $148,115 | $29,913 | $118,202 |
| 2015 | $1,874 | $127,050 | $29,913 | $97,137 |
| 2014 | $1,609 | $110,651 | $29,913 | $80,738 |
| 2013 | -- | $111,101 | $32,175 | $78,926 |
Source: Public Records
Map
Nearby Homes
- 1652 W 560 N
- 1774 W 400 N
- 575 N 1350 W Unit 137
- 1350 W 300 N Unit 49
- 1350 W 300 N Unit 38
- 1350 W 300 N Unit 29
- 563 N 1350 W Unit 139
- 1337 W 550 N Unit 195
- 1805 W 675 N
- 423 N 1250 W Unit 118
- 1832 W 725 N
- 1827 W 775 N
- 47 N 1750 W
- 607 N 2000 W
- 417 N 1200 W Unit 84
- 16 N 1300 W
- 620 N 1100 W
- 135 S 1525 W
- 1648 W 150 S
- 1828 W 75 S