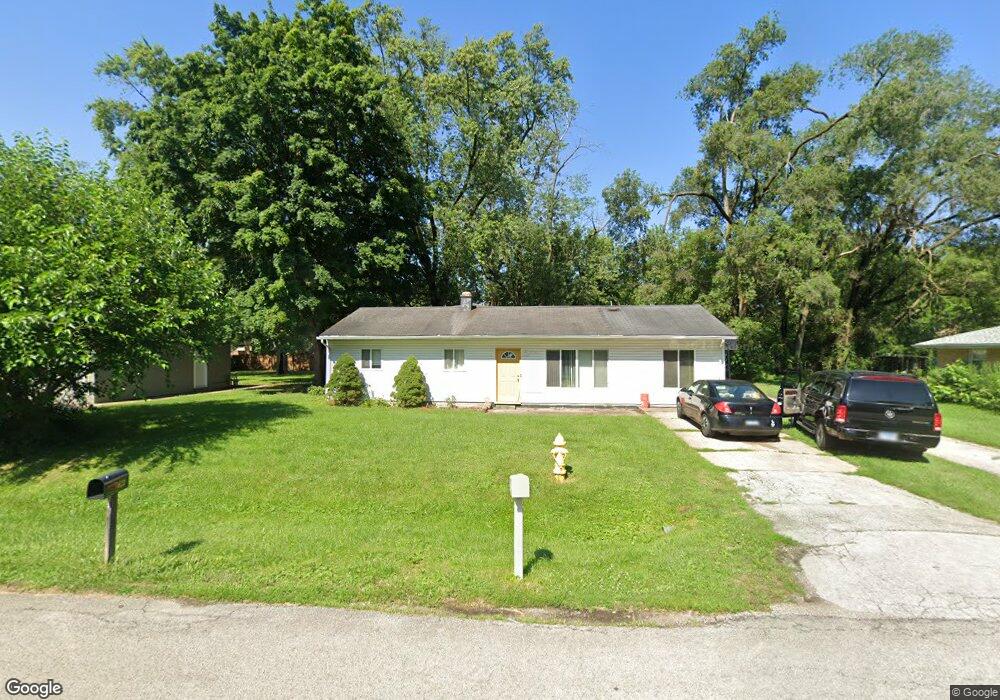
16230 Spaulding Ave Markham, IL 60428
Estimated Value: $154,458 - $188,000
4
Beds
3
Baths
1,020
Sq Ft
$174/Sq Ft
Est. Value
About This Home
This home is located at 16230 Spaulding Ave, Markham, IL 60428 and is currently estimated at $177,865, approximately $174 per square foot. 16230 Spaulding Ave is a home located in Cook County with nearby schools including Markham Park Elementary School, Prairie-Hills Junior High School, and Tinley Park High School.
Ownership History
Date
Name
Owned For
Owner Type
Purchase Details
Closed on
Sep 30, 2004
Sold by
Myers Ron and Myers Kathleen
Bought by
Cook Jewell V
Current Estimated Value
Purchase Details
Closed on
May 13, 2002
Sold by
First Union National Bank
Bought by
Myers Ron and Myers Kathleen
Home Financials for this Owner
Home Financials are based on the most recent Mortgage that was taken out on this home.
Original Mortgage
$45,000
Interest Rate
7.16%
Mortgage Type
Purchase Money Mortgage
Purchase Details
Closed on
Jan 20, 1999
Sold by
Stuewe James L and Stuewe Bever Lee
Bought by
Tyler Murian M
Home Financials for this Owner
Home Financials are based on the most recent Mortgage that was taken out on this home.
Original Mortgage
$59,500
Interest Rate
10.75%
Purchase Details
Closed on
Sep 30, 1997
Sold by
Hud
Bought by
Stuewe James L
Create a Home Valuation Report for This Property
The Home Valuation Report is an in-depth analysis detailing your home's value as well as a comparison with similar homes in the area
Home Values in the Area
Average Home Value in this Area
Purchase History
| Date | Buyer | Sale Price | Title Company |
|---|---|---|---|
| Cook Jewell V | $70,000 | Ticor Title | |
| Myers Ron | $50,000 | First American Title | |
| Tyler Murian M | $70,000 | -- | |
| Stuewe James L | -- | -- |
Source: Public Records
Mortgage History
| Date | Status | Borrower | Loan Amount |
|---|---|---|---|
| Previous Owner | Myers Ron | $45,000 | |
| Previous Owner | Tyler Murian M | $59,500 |
Source: Public Records
Tax History
| Year | Tax Paid | Tax Assessment Tax Assessment Total Assessment is a certain percentage of the fair market value that is determined by local assessors to be the total taxable value of land and additions on the property. | Land | Improvement |
|---|---|---|---|---|
| 2025 | $4,440 | $11,000 | $2,693 | $8,307 |
| 2024 | $4,440 | $11,000 | $2,693 | $8,307 |
| 2023 | $2,786 | $11,000 | $2,693 | $8,307 |
| 2022 | $2,786 | $6,831 | $2,394 | $4,437 |
| 2021 | $2,771 | $6,831 | $2,394 | $4,437 |
| 2020 | $2,883 | $6,831 | $2,394 | $4,437 |
| 2019 | $3,846 | $8,642 | $2,094 | $6,548 |
| 2018 | $3,716 | $8,642 | $2,094 | $6,548 |
| 2017 | $3,558 | $8,642 | $2,094 | $6,548 |
| 2016 | $3,098 | $7,028 | $1,795 | $5,233 |
| 2015 | $2,776 | $7,028 | $1,795 | $5,233 |
| 2014 | $2,816 | $7,028 | $1,795 | $5,233 |
| 2013 | $2,992 | $7,835 | $1,795 | $6,040 |
Source: Public Records
Map
Nearby Homes
- 16224 Kedzie Ave
- 16408 Turner Ave
- 3114 W 163rd St
- 16107 Spaulding Ave
- 16431 Spaulding Ave
- 3315 W 161st St
- 16302 Trumbull Ave
- 16110 Homan Ave
- 16213 Saint Louis Ave
- 16446 Spaulding Ave
- 16202 Saint Louis Ave
- 3027 Wilshire Ave
- 16225 Clifton Park Ave
- 16516 Turner Ave
- 3014 W 163rd St
- 3048 Sherwood Ave
- 16030 Saint Louis Ave
- 16608 Sawyer Ave
- 16632 Sawyer Ave
- 16517 Plainview Dr
- 16236 Spaulding Ave
- 16218 Spaulding Ave
- 16218 Spaulding Ave
- 16208 Spaulding Ave
- 16231 Turner Ave
- 16231 Turner Ave
- 16231 Turner Ave
- 16219 Turner Ave
- 16235 Turner Ave
- 16225 Spaulding Ave
- 16231 Spaulding Ave
- 16231 Spaulding Ave
- 16219 Spaulding Ave
- 16237 Spaulding Ave
- 16243 Spaulding Ave
- 3304 W 163rd St
- 3317 W 162nd St
- 3311 W 162nd St
- 3305 W 162nd St
- 3316 W 163rd St
Your Personal Tour Guide
Ask me questions while you tour the home.