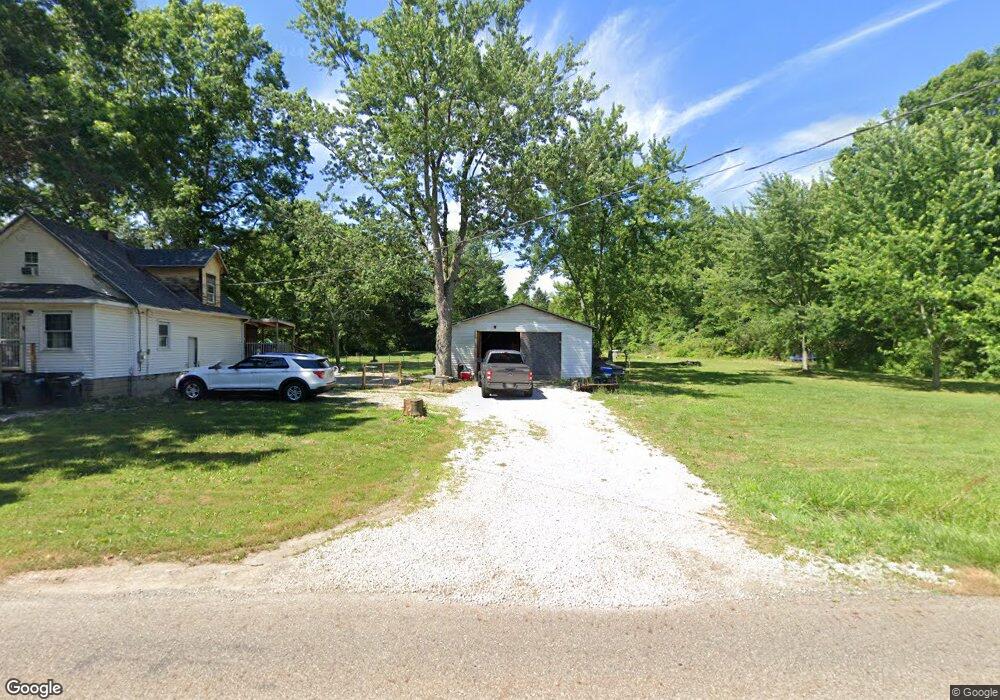
16233 Greenbower St NE Alliance, OH 44601
Estimated Value: $133,000 - $202,000
3
Beds
1
Bath
936
Sq Ft
$183/Sq Ft
Est. Value
About This Home
This home is located at 16233 Greenbower St NE, Alliance, OH 44601 and is currently estimated at $171,453, approximately $183 per square foot. 16233 Greenbower St NE is a home located in Stark County with nearby schools including Marlington High School.
Ownership History
Date
Name
Owned For
Owner Type
Purchase Details
Closed on
May 20, 2014
Sold by
Eberling Clifford John
Bought by
Eberling Ii Clifford John
Current Estimated Value
Purchase Details
Closed on
Aug 18, 1999
Sold by
Central Waste Inc
Bought by
Eberling Clifford John
Create a Home Valuation Report for This Property
The Home Valuation Report is an in-depth analysis detailing your home's value as well as a comparison with similar homes in the area
Home Values in the Area
Average Home Value in this Area
Purchase History
| Date | Buyer | Sale Price | Title Company |
|---|---|---|---|
| Eberling Ii Clifford John | -- | None Available | |
| Eberling Clifford John | $10,100 | -- |
Source: Public Records
Tax History Compared to Growth
Tax History
| Year | Tax Paid | Tax Assessment Tax Assessment Total Assessment is a certain percentage of the fair market value that is determined by local assessors to be the total taxable value of land and additions on the property. | Land | Improvement |
|---|---|---|---|---|
| 2025 | $7,309 | $61,780 | $42,740 | $19,040 |
| 2024 | $4,767 | $62,200 | $44,240 | $17,960 |
| 2023 | $4,644 | $42,420 | $25,760 | $16,660 |
| 2022 | $1,534 | $42,420 | $25,760 | $16,660 |
| 2021 | $1,518 | $42,420 | $25,760 | $16,660 |
| 2020 | $1,459 | $36,260 | $22,190 | $14,070 |
| 2019 | $1,450 | $36,280 | $22,200 | $14,080 |
| 2018 | $1,453 | $36,280 | $22,200 | $14,080 |
| 2017 | $1,244 | $29,070 | $14,960 | $14,110 |
| 2016 | $1,914 | $29,070 | $14,960 | $14,110 |
| 2015 | $1,246 | $29,070 | $14,960 | $14,110 |
| 2014 | $886 | $19,550 | $9,910 | $9,640 |
| 2013 | $441 | $19,550 | $9,910 | $9,640 |
Source: Public Records
Map
Nearby Homes
- 15789 Coalbank St NE
- 0 Knoll St NE
- 15520 Coalbank St NE
- 15995 Elbrook St NE
- 15832 Waverly St NE
- 11310 Webb Ave NE
- 11344 Walnut Ave NE
- 14723 Bolton St NE
- 652 N Webb Ave
- 20871 N Benton Rd W
- 14422 Sturbridge Rd NE
- 0 Homestead Ave NE
- 0 Johnson Ave NE Unit 5142926
- 124 E Wayne St
- 0 Meadowbrook Ave
- 710 N Freedom Ave
- 263 Franklin Ave
- 608 N Freedom Ave
- 000 Meadowbrook Ave
- 505 N Union Ave
- 16217 Greenbower St NE
- 16050 Greenbower St NE
- 16025 Greenbower St NE
- 13201 Webb Ave NE
- 15970 Greenbower St NE
- 15917 Greenbower St NE
- 15900 Greenbower St NE
- 15915 Greenbower St NE
- 15885 Greenbower St NE
- 15931 Greenbower St NE
- 12910 Webb Ave NE
- 15819 Greenbower St NE
- 15767 Greenbower St NE
- 15975 Greenbower St NE
- 11290 Oyster Rd
- 15687 Greenbower St NE
- 10675 Oyster Rd
- 15684 Greenbower St NE
- 12725 Webb Ave NE
- 15790 Coalbank St NE