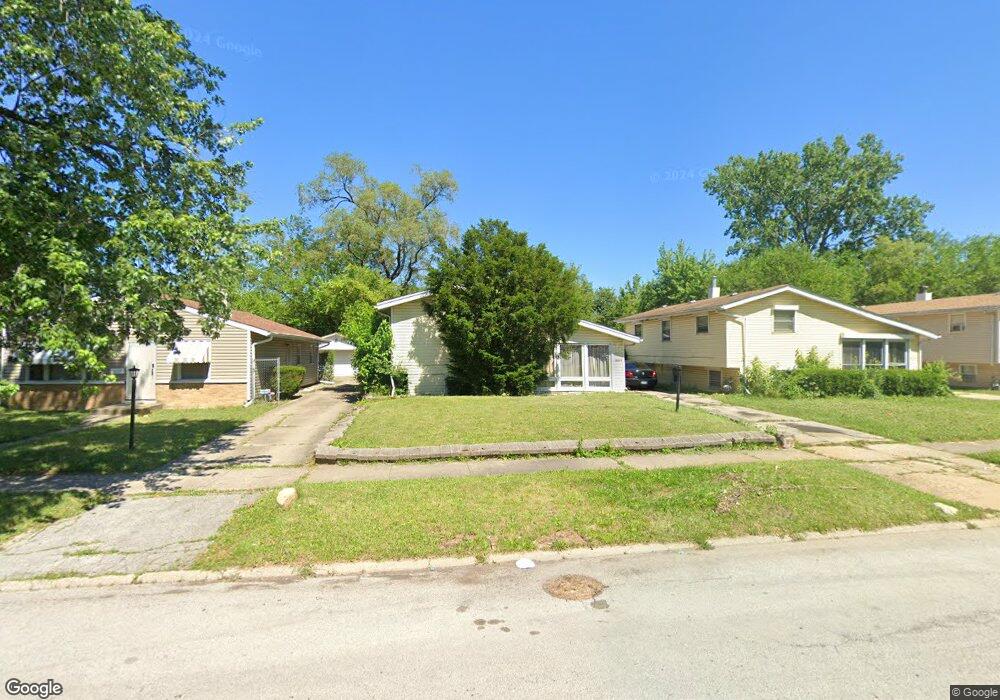
16235 Ashland Ave Markham, IL 60428
Estimated Value: $80,000 - $168,000
3
Beds
1
Bath
1,068
Sq Ft
$126/Sq Ft
Est. Value
About This Home
This home is located at 16235 Ashland Ave, Markham, IL 60428 and is currently estimated at $134,292, approximately $125 per square foot. 16235 Ashland Ave is a home located in Cook County with nearby schools including Maya Angelou Elementary School, Brooks Middle School, and Thornton Township High School.
Ownership History
Date
Name
Owned For
Owner Type
Purchase Details
Closed on
Aug 13, 2004
Sold by
Aube Brian R and Wong Benjamin W
Bought by
Cal Michael
Current Estimated Value
Home Financials for this Owner
Home Financials are based on the most recent Mortgage that was taken out on this home.
Original Mortgage
$109,800
Outstanding Balance
$62,342
Interest Rate
8.25%
Mortgage Type
Unknown
Estimated Equity
$71,950
Purchase Details
Closed on
Apr 15, 2004
Sold by
Household Finance Corp Iii
Bought by
Aube Brian R and Wong Benjamin W
Purchase Details
Closed on
Mar 29, 2004
Sold by
Arnold Lille
Bought by
Household Finance Corp Iii
Purchase Details
Closed on
Jan 27, 1997
Sold by
Victory Christian Assembly Church Baptis
Bought by
Arnold Galvin L and Arnold Lillie R
Home Financials for this Owner
Home Financials are based on the most recent Mortgage that was taken out on this home.
Original Mortgage
$27,900
Interest Rate
7.25%
Create a Home Valuation Report for This Property
The Home Valuation Report is an in-depth analysis detailing your home's value as well as a comparison with similar homes in the area
Home Values in the Area
Average Home Value in this Area
Purchase History
| Date | Buyer | Sale Price | Title Company |
|---|---|---|---|
| Cal Michael | $122,000 | First American Title Ins Co | |
| Aube Brian R | $58,000 | Premier Title | |
| Household Finance Corp Iii | -- | -- | |
| Arnold Galvin L | $31,000 | -- |
Source: Public Records
Mortgage History
| Date | Status | Borrower | Loan Amount |
|---|---|---|---|
| Open | Cal Michael | $109,800 | |
| Previous Owner | Arnold Galvin L | $27,900 | |
| Closed | Cal Michael | $6,100 |
Source: Public Records
Tax History Compared to Growth
Tax History
| Year | Tax Paid | Tax Assessment Tax Assessment Total Assessment is a certain percentage of the fair market value that is determined by local assessors to be the total taxable value of land and additions on the property. | Land | Improvement |
|---|---|---|---|---|
| 2024 | $2,462 | $7,300 | $1,843 | $5,457 |
| 2023 | $898 | $7,300 | $1,843 | $5,457 |
| 2022 | $898 | $4,489 | $1,559 | $2,930 |
| 2021 | $936 | $4,489 | $1,559 | $2,930 |
| 2020 | $1,140 | $4,489 | $1,559 | $2,930 |
| 2019 | $4,371 | $9,025 | $1,417 | $7,608 |
| 2018 | $4,239 | $9,025 | $1,417 | $7,608 |
| 2017 | $4,121 | $9,025 | $1,417 | $7,608 |
| 2016 | $3,902 | $8,370 | $1,275 | $7,095 |
| 2015 | $3,559 | $8,370 | $1,275 | $7,095 |
| 2014 | $3,570 | $8,370 | $1,275 | $7,095 |
| 2013 | $4,437 | $9,877 | $1,275 | $8,602 |
Source: Public Records
Map
Nearby Homes
- 16333 Justine St
- 16340 Justine St
- 16122 Ashland Ave
- 16354 Justine St
- 1716 W 163rd St
- 16118 Paulina St
- 16329 Hermitage Ave
- 16423 Marshfield Ave
- 16154 Wood St
- 16145 Honore Ave
- 16018 Loomis Ave
- 16510 Marshfield Ave
- 16019 Wood St
- 1848 W 163rd St
- 16324 Honore Ave
- 16527 Marshfield Ave
- 15944 Paulina St
- 16535 Hermitage Ave
- 16547 Paulina St
- 16427 Wolcott Ave
- 16239 Ashland Ave
- 16231 Ashland Ave
- 16243 Ashland Ave
- 16225 Ashland Ave
- 16221 Ashland Ave
- 16221 Ashland Ave
- 16249 Ashland Ave
- 16236 Justine St
- 16224 Justine St
- 16244 Justine St
- 16215 Ashland Ave
- 16253 Ashland Ave
- 16230 Ashland Ave
- 16236 Ashland Ave
- 16220 Justine St
- 16226 Ashland Ave
- 16248 Justine St
- 16246 Ashland Ave
- 16246 Ashland Ave
- 16222 Ashland Ave