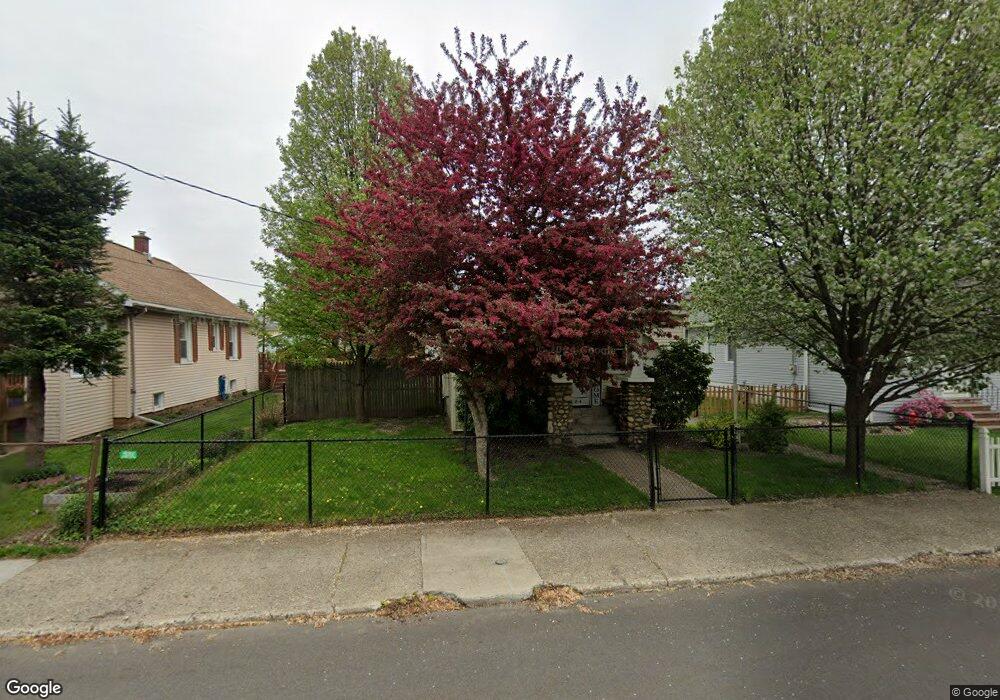
1624 9th Ave Watervliet, NY 12189
Estimated Value: $184,000 - $223,415
2
Beds
1
Bath
1,012
Sq Ft
$204/Sq Ft
Est. Value
About This Home
This home is located at 1624 9th Ave, Watervliet, NY 12189 and is currently estimated at $206,354, approximately $203 per square foot. 1624 9th Ave is a home located in Albany County with nearby schools including Watervliet Elementary School, Watervliet Junior/Senior High School, and KIPP Troy Prep High School.
Ownership History
Date
Name
Owned For
Owner Type
Purchase Details
Closed on
May 19, 2005
Sold by
Farrell Timothy D
Bought by
Spinelli Gregory W
Current Estimated Value
Home Financials for this Owner
Home Financials are based on the most recent Mortgage that was taken out on this home.
Original Mortgage
$90,000
Outstanding Balance
$46,776
Interest Rate
5.79%
Mortgage Type
New Conventional
Estimated Equity
$159,578
Purchase Details
Closed on
Mar 12, 1997
Sold by
Fayles Mildred M
Bought by
Farrell Timothy D and Landrigan Nancy L
Create a Home Valuation Report for This Property
The Home Valuation Report is an in-depth analysis detailing your home's value as well as a comparison with similar homes in the area
Home Values in the Area
Average Home Value in this Area
Purchase History
| Date | Buyer | Sale Price | Title Company |
|---|---|---|---|
| Spinelli Gregory W | $115,000 | Robert W Tecler | |
| Farrell Timothy D | $73,500 | -- |
Source: Public Records
Mortgage History
| Date | Status | Borrower | Loan Amount |
|---|---|---|---|
| Open | Spinelli Gregory W | $90,000 |
Source: Public Records
Tax History Compared to Growth
Tax History
| Year | Tax Paid | Tax Assessment Tax Assessment Total Assessment is a certain percentage of the fair market value that is determined by local assessors to be the total taxable value of land and additions on the property. | Land | Improvement |
|---|---|---|---|---|
| 2024 | $3,575 | $105,900 | $31,900 | $74,000 |
| 2023 | $3,407 | $105,900 | $31,900 | $74,000 |
| 2022 | $3,261 | $105,900 | $31,900 | $74,000 |
| 2021 | $3,224 | $105,900 | $31,900 | $74,000 |
| 2020 | $3,118 | $105,900 | $31,900 | $74,000 |
| 2019 | $3,285 | $105,900 | $31,900 | $74,000 |
| 2018 | $3,034 | $105,900 | $31,900 | $74,000 |
| 2017 | $2,820 | $105,900 | $31,900 | $74,000 |
| 2016 | $2,716 | $105,900 | $31,900 | $74,000 |
| 2015 | -- | $115,200 | $31,600 | $83,600 |
| 2014 | -- | $115,200 | $31,600 | $83,600 |
Source: Public Records
Map
Nearby Homes