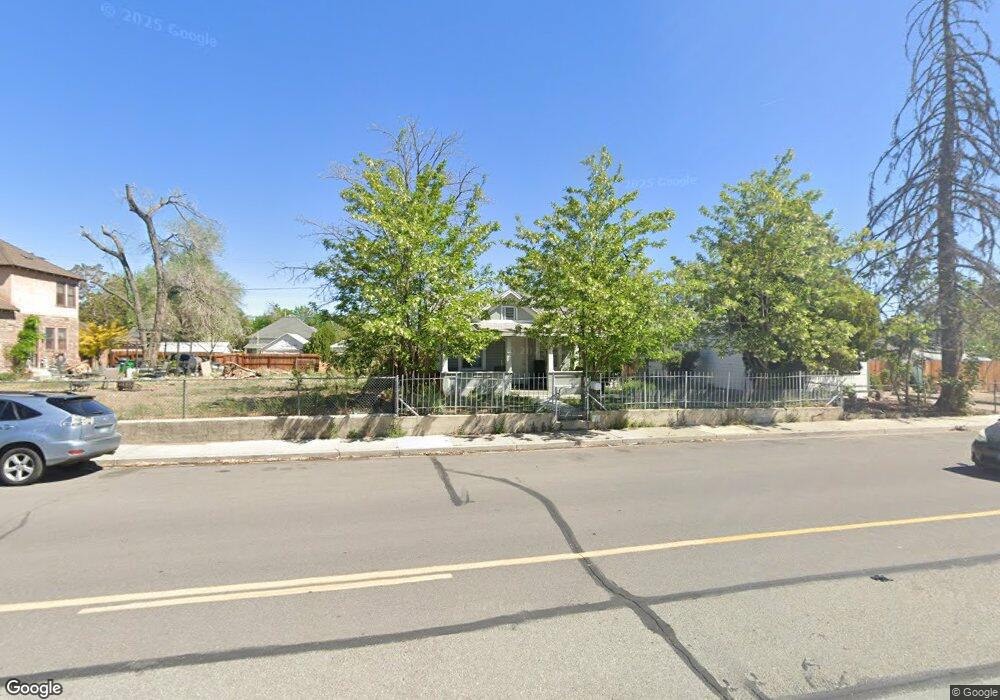
1624 C St Sparks, NV 89431
Downtown Sparks NeighborhoodEstimated Value: $274,000 - $296,157
2
Beds
1
Bath
1,080
Sq Ft
$266/Sq Ft
Est. Value
About This Home
This home is located at 1624 C St, Sparks, NV 89431 and is currently estimated at $287,289, approximately $266 per square foot. 1624 C St is a home located in Washoe County with nearby schools including Robert Mitchell Elementary School, Sparks Middle School, and Sparks High School.
Ownership History
Date
Name
Owned For
Owner Type
Purchase Details
Closed on
Jun 10, 2024
Sold by
County Of Washoe
Bought by
County Of Washoe
Current Estimated Value
Purchase Details
Closed on
Feb 26, 2020
Sold by
Mokofisi Sione S
Bought by
Lolo Mokofisi Lute K
Home Financials for this Owner
Home Financials are based on the most recent Mortgage that was taken out on this home.
Original Mortgage
$122,500
Interest Rate
3.6%
Mortgage Type
Commercial
Purchase Details
Closed on
Mar 31, 2011
Sold by
Wells Fargo Bank N A
Bought by
Lolo Mokofisi Lute K
Purchase Details
Closed on
Feb 25, 2011
Sold by
Bitz Spencer and Bitz Dewees
Bought by
Wells Fargo Bank Na
Purchase Details
Closed on
Jan 28, 2005
Sold by
Bitz Spencer and Bitz De Wees
Bought by
Bitz Spencer T and Bitz De Wees L
Home Financials for this Owner
Home Financials are based on the most recent Mortgage that was taken out on this home.
Original Mortgage
$100,500
Interest Rate
4.93%
Mortgage Type
Negative Amortization
Create a Home Valuation Report for This Property
The Home Valuation Report is an in-depth analysis detailing your home's value as well as a comparison with similar homes in the area
Home Values in the Area
Average Home Value in this Area
Purchase History
| Date | Buyer | Sale Price | Title Company |
|---|---|---|---|
| County Of Washoe | -- | None Listed On Document | |
| Lolo Mokofisi Lute K | -- | First American Title Sparks | |
| Lolo Mokofisi Lute K | $45,000 | Ticor Title Reno | |
| Wells Fargo Bank Na | $44,264 | None Available | |
| Bitz Spencer T | -- | Western Title Incorporated | |
| Bitz Spencer | -- | Western Title Incorporated |
Source: Public Records
Mortgage History
| Date | Status | Borrower | Loan Amount |
|---|---|---|---|
| Previous Owner | Lolo Mokofisi Lute K | $122,500 | |
| Previous Owner | Bitz Spencer | $100,500 |
Source: Public Records
Tax History Compared to Growth
Tax History
| Year | Tax Paid | Tax Assessment Tax Assessment Total Assessment is a certain percentage of the fair market value that is determined by local assessors to be the total taxable value of land and additions on the property. | Land | Improvement |
|---|---|---|---|---|
| 2025 | $1,490 | $43,255 | $31,675 | $11,580 |
| 2024 | $1,490 | $39,232 | $27,860 | $11,372 |
| 2023 | $1,487 | $41,168 | $30,625 | $10,543 |
| 2022 | $1,072 | $31,308 | $22,680 | $8,628 |
| 2021 | $471 | $24,669 | $16,275 | $8,394 |
| 2020 | $442 | $24,057 | $15,820 | $8,237 |
| 2019 | $1,069 | $21,410 | $13,615 | $7,795 |
| 2018 | $1,110 | $17,707 | $10,220 | $7,487 |
| 2017 | $2,263 | $17,080 | $9,555 | $7,525 |
| 2016 | $375 | $14,863 | $7,420 | $7,443 |
| 2015 | $374 | $13,229 | $5,775 | $7,454 |
| 2014 | $340 | $10,836 | $3,815 | $7,021 |
| 2013 | -- | $9,537 | $2,730 | $6,807 |
Source: Public Records
Map
Nearby Homes