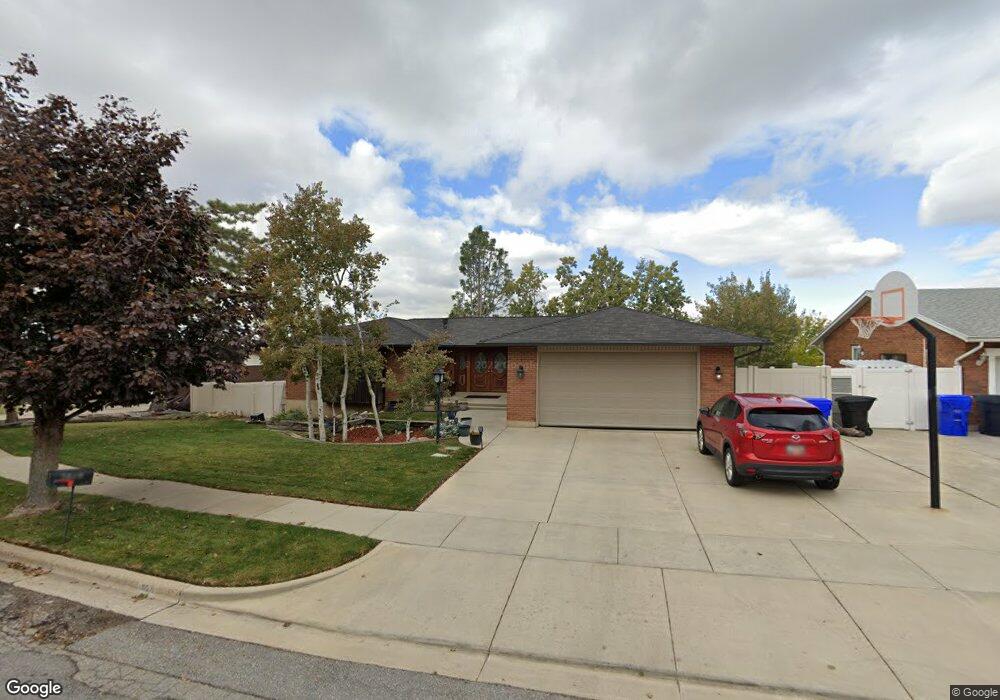
1624 Charlene Dr Bountiful, UT 84010
Estimated Value: $553,000 - $700,000
5
Beds
3
Baths
2,919
Sq Ft
$220/Sq Ft
Est. Value
About This Home
This home is located at 1624 Charlene Dr, Bountiful, UT 84010 and is currently estimated at $642,560, approximately $220 per square foot. 1624 Charlene Dr is a home located in Davis County with nearby schools including Valley View School, Mueller Park Junior High School, and Bountiful High School.
Ownership History
Date
Name
Owned For
Owner Type
Purchase Details
Closed on
Sep 24, 2002
Sold by
Steppig Brhett A
Bought by
Steppig Brhett and Steppig Heather
Current Estimated Value
Purchase Details
Closed on
Jun 14, 2002
Sold by
Brhett & Heather Steppig Living Trust and Steppig Brhett
Bought by
Knighton Kody K
Home Financials for this Owner
Home Financials are based on the most recent Mortgage that was taken out on this home.
Original Mortgage
$196,000
Outstanding Balance
$105,442
Interest Rate
10.99%
Estimated Equity
$537,118
Purchase Details
Closed on
Jan 3, 2002
Sold by
Steppig Brhett and Steppig Heather
Bought by
Brhett & Heather Stepping Living Trust
Purchase Details
Closed on
Jul 19, 2001
Sold by
Burnham Lonnie K and Burnham Christine A
Bought by
Steppig Brhett A
Home Financials for this Owner
Home Financials are based on the most recent Mortgage that was taken out on this home.
Original Mortgage
$182,500
Interest Rate
7.21%
Create a Home Valuation Report for This Property
The Home Valuation Report is an in-depth analysis detailing your home's value as well as a comparison with similar homes in the area
Purchase History
| Date | Buyer | Sale Price | Title Company |
|---|---|---|---|
| Steppig Brhett | -- | United Title Services | |
| Knighton Kody K | -- | United Title Services | |
| Brhett & Heather Stepping Living Trust | -- | Meridian Title Company | |
| Steppig Brhett A | -- | Meridian Title Company |
Source: Public Records
Mortgage History
| Date | Status | Borrower | Loan Amount |
|---|---|---|---|
| Open | Knighton Kody K | $196,000 | |
| Previous Owner | Steppig Brhett A | $182,500 |
Source: Public Records
Tax History
| Year | Tax Paid | Tax Assessment Tax Assessment Total Assessment is a certain percentage of the fair market value that is determined by local assessors to be the total taxable value of land and additions on the property. | Land | Improvement |
|---|---|---|---|---|
| 2025 | $3,703 | $341,550 | $128,497 | $213,053 |
| 2024 | $3,637 | $347,600 | $118,555 | $229,045 |
| 2023 | $3,668 | $637,000 | $213,898 | $423,102 |
| 2022 | $3,775 | $359,700 | $113,751 | $245,949 |
| 2021 | $3,377 | $492,000 | $168,976 | $323,024 |
| 2020 | $2,973 | $435,000 | $169,274 | $265,726 |
| 2019 | $2,961 | $423,000 | $169,360 | $253,640 |
| 2018 | $2,847 | $393,000 | $156,968 | $236,032 |
| 2016 | $2,591 | $189,420 | $49,891 | $139,529 |
| 2015 | $2,590 | $178,970 | $49,891 | $129,079 |
| 2014 | $2,217 | $154,954 | $49,891 | $105,063 |
| 2013 | -- | $144,233 | $52,687 | $91,546 |
Source: Public Records
Map
Nearby Homes
- 631 E 1700 S
- 795 Abby Ln Unit 5
- 861 E Millbrook Way
- 438 E 1800 S
- 1886 S Jeri Dr
- 380 E 1500 S
- 1087 Arlington Way
- 288 E 1650 S
- 626 E 2150 S
- 2059 S 350 E Unit 6
- 2136 Elaine Dr
- 291 E 1950 S
- 2038 S 350 E Unit 3
- 2046 S 350 E Unit 4
- 842 E 2150 S
- 141 E 1650 S
- 320 E 2100 S
- 188 E 2050 S Unit D3
- 323 Peach Ln
- 2064 S Orchard Dr
- 1604 Charlene Dr
- 743 Charlene Dr
- 1615 S Davis Blvd
- 1631 S Davis Blvd
- 1593 S Davis Blvd
- 1643 Charlene Dr
- 1627 Charlene Dr
- 1588 Charlene Dr
- 760 Charlene Dr
- 1605 Charlene Dr
- 1645 S Davis Blvd
- 742 E Charlene Way
- 1583 S Davis Blvd
- 1603 Charlene Dr
- 742 Charlene Dr
- 1572 Charlene Dr
- 799 Emerald Hills Dr
- 1648 Emerald Hills Dr
- 789 Emerald Hills Dr
- 1638 Emerald Hills Dr
Your Personal Tour Guide
Ask me questions while you tour the home.