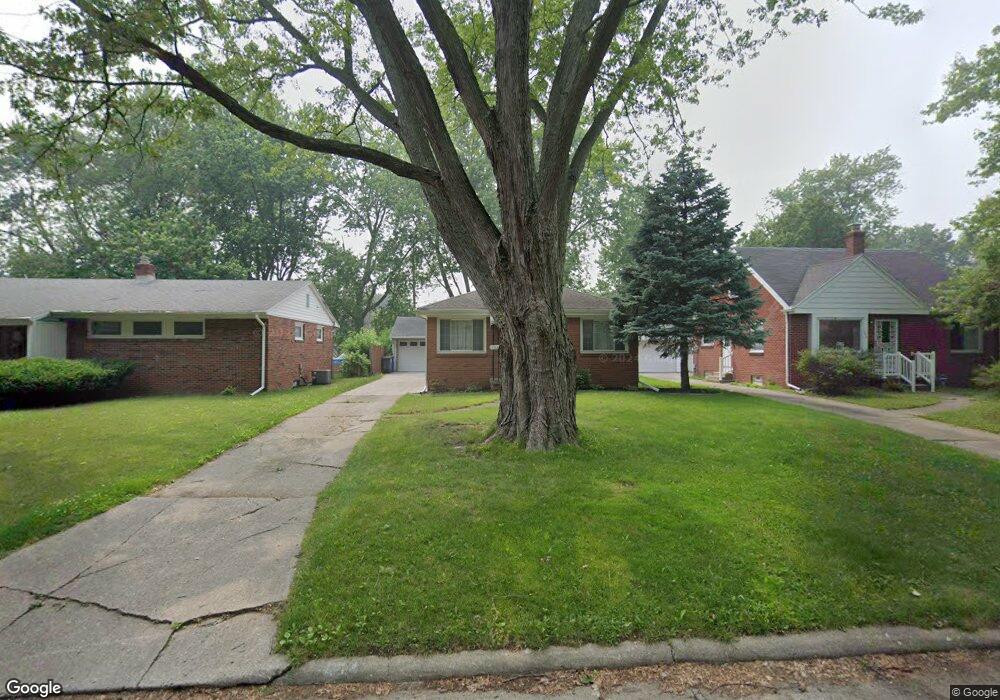
1624 Colleen Ct Toledo, OH 43614
Glendale-Heatherdowns NeighborhoodEstimated Value: $137,000 - $159,456
3
Beds
1
Bath
1,014
Sq Ft
$145/Sq Ft
Est. Value
About This Home
This home is located at 1624 Colleen Ct, Toledo, OH 43614 and is currently estimated at $146,864, approximately $144 per square foot. 1624 Colleen Ct is a home located in Lucas County with nearby schools including Byrnedale Elementary School, Bowsher High School, and Our Lady of Perpetual Help School.
Ownership History
Date
Name
Owned For
Owner Type
Purchase Details
Closed on
Aug 9, 2011
Sold by
Federal Home Loan Mortgage Corporation
Bought by
Rossler Pamela J
Current Estimated Value
Home Financials for this Owner
Home Financials are based on the most recent Mortgage that was taken out on this home.
Original Mortgage
$36,100
Interest Rate
4.14%
Mortgage Type
New Conventional
Purchase Details
Closed on
Apr 14, 2011
Sold by
Acker Richard G
Bought by
Federal Home Loan Mortgage Corporation
Purchase Details
Closed on
Mar 21, 2006
Sold by
Kohne Dean E
Bought by
Acker Richard G
Home Financials for this Owner
Home Financials are based on the most recent Mortgage that was taken out on this home.
Original Mortgage
$105,450
Interest Rate
6.33%
Mortgage Type
Fannie Mae Freddie Mac
Purchase Details
Closed on
Jan 21, 1993
Sold by
Kohne Dean E
Purchase Details
Closed on
Apr 5, 1990
Sold by
Kohne June B
Purchase Details
Closed on
Mar 29, 1990
Sold by
Kohne Wayne E
Create a Home Valuation Report for This Property
The Home Valuation Report is an in-depth analysis detailing your home's value as well as a comparison with similar homes in the area
Home Values in the Area
Average Home Value in this Area
Purchase History
| Date | Buyer | Sale Price | Title Company |
|---|---|---|---|
| Rossler Pamela J | $51,100 | None Available | |
| Federal Home Loan Mortgage Corporation | $59,334 | None Available | |
| Acker Richard G | $111,000 | None Available | |
| -- | -- | -- | |
| -- | $47,500 | -- | |
| -- | -- | -- |
Source: Public Records
Mortgage History
| Date | Status | Borrower | Loan Amount |
|---|---|---|---|
| Previous Owner | Rossler Pamela J | $36,100 | |
| Previous Owner | Acker Richard G | $105,450 |
Source: Public Records
Tax History Compared to Growth
Tax History
| Year | Tax Paid | Tax Assessment Tax Assessment Total Assessment is a certain percentage of the fair market value that is determined by local assessors to be the total taxable value of land and additions on the property. | Land | Improvement |
|---|---|---|---|---|
| 2024 | $51 | $32,620 | $7,280 | $25,340 |
| 2023 | $1,726 | $26,215 | $13,300 | $12,915 |
| 2022 | $1,720 | $26,215 | $13,300 | $12,915 |
| 2021 | $1,757 | $26,215 | $13,300 | $12,915 |
| 2020 | $1,650 | $21,525 | $10,920 | $10,605 |
| 2019 | $1,609 | $21,525 | $10,920 | $10,605 |
| 2018 | $1,524 | $21,525 | $10,920 | $10,605 |
| 2017 | $1,447 | $18,200 | $9,240 | $8,960 |
| 2016 | $1,450 | $52,000 | $26,400 | $25,600 |
| 2015 | $1,438 | $52,000 | $26,400 | $25,600 |
| 2014 | $1,145 | $18,200 | $9,240 | $8,960 |
| 2013 | $1,145 | $18,200 | $9,240 | $8,960 |
Source: Public Records
Map
Nearby Homes
- 1629 Carmelle Ct
- 3118 Muirfield Ave
- 3042 Schneider Rd
- 3042 Cragmoor Ave
- 1848 Brierheath Ave
- 2921 Schneider Rd
- 3157 Strathmoor Ave
- 3546 Denise Dr
- 3133 Glencairn Ave
- 1351 Bensch Dr
- 1912 Glencairn Ave
- 3027 Glencairn Ave
- 3148 Glanzman Rd
- 1926 Meadowlark Ave
- 1518 Wilmore Dr
- 3729 Linden Green Dr
- 3607 Roberta Dr
- 1953 Heatherlawn Dr
- 2134 Tedrow Rd
- 3813 Glendale Ave
- 1616 Colleen Ct
- 1630 Colleen Ct
- 1610 Colleen Ct
- 1636 Colleen Ct
- 1602 Colleen Ct
- 1642 Colleen Ct
- 1621 Colleen Ct
- 1627 Colleen Ct
- 1617 Colleen Ct
- 1564 Colleen Ct
- 1635 Colleen Ct
- 1609 Colleen Ct
- 1648 Colleen Ct
- 1641 Colleen Ct
- 1603 Colleen Ct
- 1558 Colleen Ct
- 1561 Colleen Ct
- 1647 Colleen Ct
- 1554 Colleen Ct
- 1626 Carmelle Ct