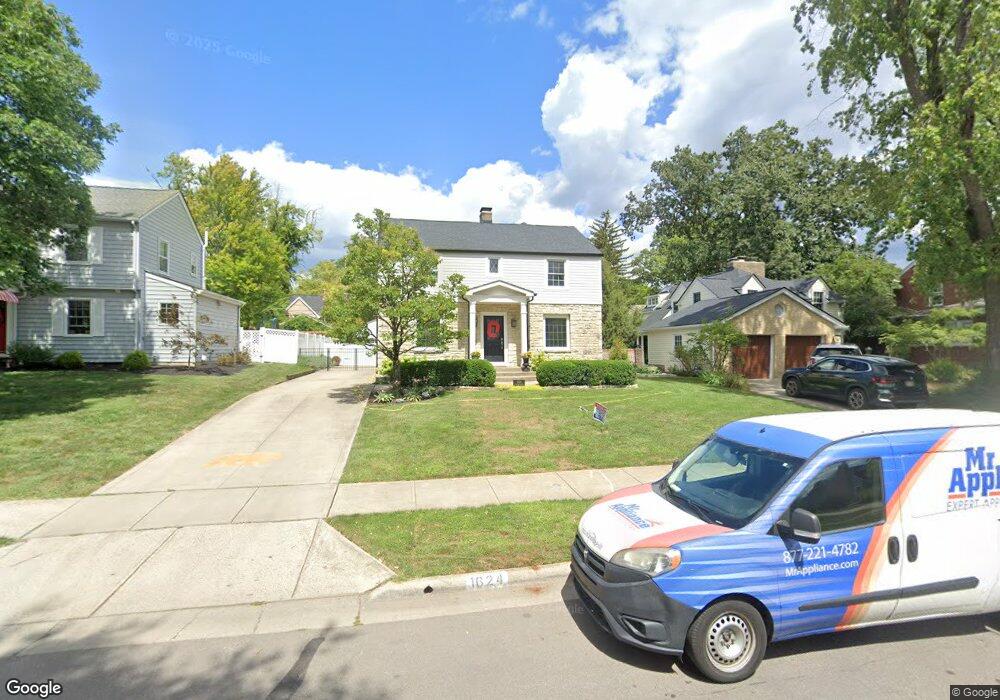
1624 Grenoble Rd Columbus, OH 43221
Estimated Value: $748,268 - $905,000
3
Beds
3
Baths
2,652
Sq Ft
$308/Sq Ft
Est. Value
About This Home
This home is located at 1624 Grenoble Rd, Columbus, OH 43221 and is currently estimated at $816,317, approximately $307 per square foot. 1624 Grenoble Rd is a home located in Franklin County with nearby schools including Barrington Road Elementary School, Jones Middle School, and Upper Arlington High School.
Ownership History
Date
Name
Owned For
Owner Type
Purchase Details
Closed on
Jun 5, 2013
Sold by
Reed Mary E
Bought by
Maurer Thomas J and Maurer Krystal R
Current Estimated Value
Home Financials for this Owner
Home Financials are based on the most recent Mortgage that was taken out on this home.
Original Mortgage
$411,750
Outstanding Balance
$287,436
Interest Rate
3.38%
Mortgage Type
New Conventional
Estimated Equity
$528,881
Purchase Details
Closed on
Jun 22, 1992
Bought by
Reed Mary E
Purchase Details
Closed on
Jun 1, 1987
Purchase Details
Closed on
Oct 1, 1985
Create a Home Valuation Report for This Property
The Home Valuation Report is an in-depth analysis detailing your home's value as well as a comparison with similar homes in the area
Home Values in the Area
Average Home Value in this Area
Purchase History
| Date | Buyer | Sale Price | Title Company |
|---|---|---|---|
| Maurer Thomas J | $457,500 | None Available | |
| Reed Mary E | $166,000 | -- | |
| -- | $115,000 | -- | |
| -- | -- | -- |
Source: Public Records
Mortgage History
| Date | Status | Borrower | Loan Amount |
|---|---|---|---|
| Open | Maurer Thomas J | $411,750 |
Source: Public Records
Tax History
| Year | Tax Paid | Tax Assessment Tax Assessment Total Assessment is a certain percentage of the fair market value that is determined by local assessors to be the total taxable value of land and additions on the property. | Land | Improvement |
|---|---|---|---|---|
| 2025 | $12,172 | $202,660 | $71,300 | $131,360 |
| 2024 | $12,172 | $202,660 | $71,300 | $131,360 |
| 2023 | $12,027 | $202,650 | $71,295 | $131,355 |
| 2022 | $11,845 | $164,430 | $45,360 | $119,070 |
| 2021 | $10,629 | $164,430 | $45,360 | $119,070 |
| 2020 | $10,436 | $164,430 | $45,360 | $119,070 |
| 2019 | $9,825 | $136,570 | $45,360 | $91,210 |
| 2018 | $9,758 | $136,570 | $45,360 | $91,210 |
| 2017 | $9,719 | $136,570 | $45,360 | $91,210 |
| 2016 | $9,778 | $143,920 | $36,610 | $107,310 |
| 2015 | $9,744 | $143,920 | $36,610 | $107,310 |
| 2014 | $9,518 | $143,920 | $36,610 | $107,310 |
| 2013 | $4,595 | $130,830 | $33,285 | $97,545 |
Source: Public Records
Map
Nearby Homes
- 1627 Doone Rd
- 1780 Waltham Rd
- 1565 Berkshire Rd
- 1956 Glenn Ave
- 1951 Glenn Ave
- 1508 Berkshire Rd
- 1921 Wyandotte Rd
- 1876 Westwood Ave
- 1942 Bedford Rd
- 1869 Tewksbury Rd
- 1810 Ashland Ave
- 2240 Coventry Rd Unit 2240
- 1838 Berkshire Rd
- 1845 Northwest Ct Unit D
- 1785 Northwest Ct Unit D
- 1775 Northwest Ct Unit 105
- 1865 Collingswood Rd
- 1799 Kings Ct Unit B
- 2208 Arlington Ave
- 2577 Westmont Blvd
- 1618 Grenoble Rd
- 1632 Grenoble Rd
- 1640 Grenoble Rd
- 1604 Grenoble Rd
- 1619 Guilford Rd
- 1611 Guilford Rd
- 1625 Guilford Rd
- 1648 Grenoble Rd
- 1625 Grenoble Rd
- 1603 Guilford Rd
- 1635 Guilford Rd
- 1633 Grenoble Rd
- 1619 Grenoble Rd
- 1641 Grenoble Rd
- 1656 Grenoble Rd
- 1645 Guilford Rd
- 1592 Grenoble Rd
- 1649 Grenoble Rd
- 1603 Grenoble Rd
- 1587 Guilford Rd
Your Personal Tour Guide
Ask me questions while you tour the home.