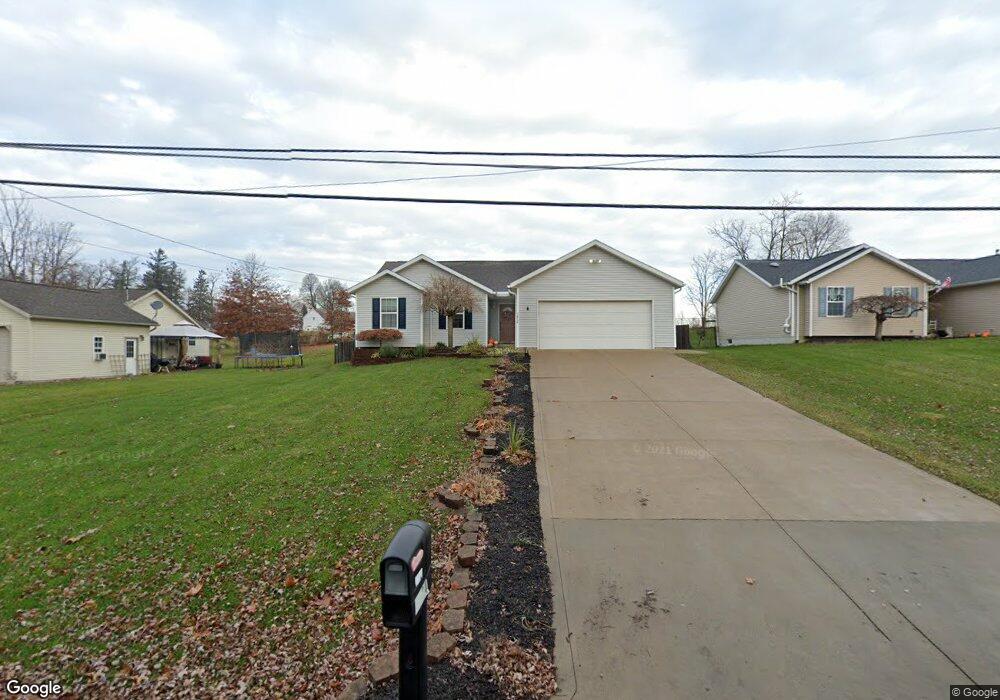
1624 Lindaire Ln E Ontario, OH 44906
Estimated Value: $264,000 - $289,000
3
Beds
2
Baths
1,410
Sq Ft
$198/Sq Ft
Est. Value
About This Home
This home is located at 1624 Lindaire Ln E, Ontario, OH 44906 and is currently estimated at $279,726, approximately $198 per square foot. 1624 Lindaire Ln E is a home located in Richland County with nearby schools including Stingel Elementary School, Ontario Middle School, and Ontario High School.
Ownership History
Date
Name
Owned For
Owner Type
Purchase Details
Closed on
Jan 31, 2019
Sold by
Platner Michelle M
Bought by
Thornton Grant A
Current Estimated Value
Home Financials for this Owner
Home Financials are based on the most recent Mortgage that was taken out on this home.
Original Mortgage
$155,677
Outstanding Balance
$137,144
Interest Rate
4.6%
Mortgage Type
New Conventional
Estimated Equity
$142,582
Purchase Details
Closed on
Jan 29, 2015
Sold by
Platner Timothy M
Bought by
Platner Michelle M
Purchase Details
Closed on
Mar 24, 2006
Sold by
The Hoffman Family Revocable Living Trus and Hoffman Paul E
Bought by
Platner Timothy M and Platner Michelle M
Home Financials for this Owner
Home Financials are based on the most recent Mortgage that was taken out on this home.
Original Mortgage
$153,122
Interest Rate
6.37%
Mortgage Type
VA
Purchase Details
Closed on
Apr 30, 1993
Sold by
Hoffman Paul E
Bought by
Hoffman Family Revocable
Create a Home Valuation Report for This Property
The Home Valuation Report is an in-depth analysis detailing your home's value as well as a comparison with similar homes in the area
Home Values in the Area
Average Home Value in this Area
Purchase History
| Date | Buyer | Sale Price | Title Company |
|---|---|---|---|
| Thornton Grant A | $153,000 | Southern Title | |
| Platner Michelle M | -- | None Available | |
| Platner Timothy M | $149,900 | Southern Title | |
| Hoffman Family Revocable | -- | -- |
Source: Public Records
Mortgage History
| Date | Status | Borrower | Loan Amount |
|---|---|---|---|
| Open | Thornton Grant A | $155,677 | |
| Previous Owner | Platner Timothy M | $153,122 |
Source: Public Records
Tax History Compared to Growth
Tax History
| Year | Tax Paid | Tax Assessment Tax Assessment Total Assessment is a certain percentage of the fair market value that is determined by local assessors to be the total taxable value of land and additions on the property. | Land | Improvement |
|---|---|---|---|---|
| 2024 | $3,870 | $77,650 | $9,140 | $68,510 |
| 2023 | $3,870 | $77,650 | $9,140 | $68,510 |
| 2022 | $2,934 | $50,660 | $7,050 | $43,610 |
| 2021 | $2,939 | $50,660 | $7,050 | $43,610 |
| 2020 | $3,137 | $50,660 | $7,050 | $43,610 |
| 2019 | $2,938 | $42,930 | $5,970 | $36,960 |
| 2018 | $2,494 | $42,930 | $5,970 | $36,960 |
| 2017 | $2,454 | $42,930 | $5,970 | $36,960 |
| 2016 | $2,551 | $44,360 | $5,800 | $38,560 |
| 2015 | $2,551 | $44,360 | $5,800 | $38,560 |
| 2014 | $2,554 | $44,360 | $5,800 | $38,560 |
| 2012 | $1,197 | $45,730 | $5,970 | $39,760 |
Source: Public Records
Map
Nearby Homes
- 720 Lindaire Ln E
- 1496 W 4th St
- 2585 Deerfield Ln
- 1915 Teakwood Dr Unit 1915
- 1909 Teakwood Dr
- 1947 Teakwood Dr
- 1431 Silver Ln
- 204 Lasalle St
- 2007 Teakwood Dr
- 2010 Teakwood Dr
- 147 Wimbledon Dr
- 340 Boston Ave
- 143 Buckeye Ave
- 1592 Walker Woods Blvd
- 0 W Fourth St - Trimble Lenox
- Lot 2 Spring Village Ln
- 0 Spring Village Ln
- 99 Scotland Blvd
- 1598-1600 Spring Village Ln
- 1996 Park Ave W
- 1616 Lindaire Ln E
- 1632 Lindaire Ln E
- 1608 Lindaire Ln E
- 1627 Lindaire Ln E
- 1605 Lindaire Ln E
- 1600 Lindaire Ln E
- 1658 Lindaire Ln E
- 1599 Lindaire Ln E
- 1666 Olive Dr
- 0 N Home Rd
- 1670 Lindaire Ln E
- 1670 Lindaire Ln E
- 1568 Lindaire Ln E Unit 1588
- 1571 Lindaire Ln E
- 1676 Lindaire Ln E
- 1560 Lindaire Ln E
- 716 Lindaire Ln E
- 1665 Olive Dr
- 1561 Lindaire Ln E
- 1686 Lindaire Ln E