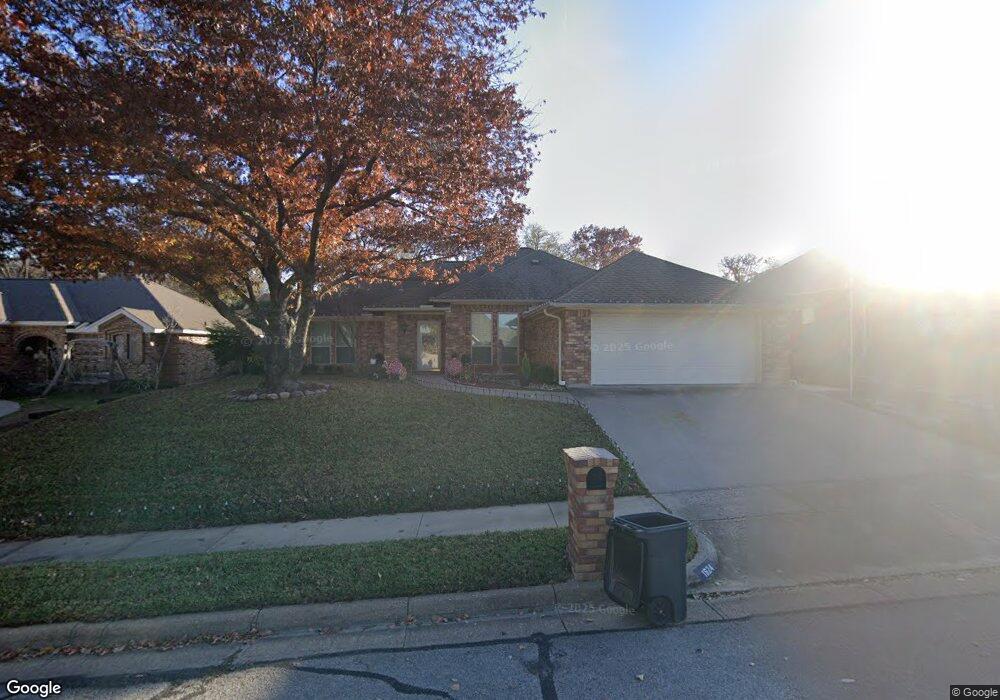
1624 Saxon Dr Bedford, TX 76021
Estimated Value: $398,000 - $419,000
3
Beds
2
Baths
2,011
Sq Ft
$202/Sq Ft
Est. Value
About This Home
This home is located at 1624 Saxon Dr, Bedford, TX 76021 and is currently estimated at $405,906, approximately $201 per square foot. 1624 Saxon Dr is a home located in Tarrant County with nearby schools including Spring Garden Elementary School, Harwood Junior High School, and Trinity High School.
Ownership History
Date
Name
Owned For
Owner Type
Purchase Details
Closed on
Feb 14, 2024
Sold by
Ulloa Baltazar James
Bought by
Ulloa Jose Jaimes and Velazquez Magdalena Otero
Current Estimated Value
Purchase Details
Closed on
Jul 13, 2023
Sold by
Teague Craig
Bought by
Ulloa Baltazar Jaimes
Home Financials for this Owner
Home Financials are based on the most recent Mortgage that was taken out on this home.
Original Mortgage
$40,000
Interest Rate
6.79%
Mortgage Type
Seller Take Back
Purchase Details
Closed on
Mar 29, 2023
Sold by
Sullivan Teague Donna Jeanne
Bought by
Teague Craig William
Purchase Details
Closed on
Sep 15, 2005
Sold by
Suiter James R and Suiter Barbara R
Bought by
Teague Jack W and Teague Donna J
Purchase Details
Closed on
Aug 29, 1996
Sold by
Lombardi Susan and Boutwell Susan
Bought by
Sutter James R and Sutter Barbara B
Home Financials for this Owner
Home Financials are based on the most recent Mortgage that was taken out on this home.
Original Mortgage
$103,200
Interest Rate
8.27%
Create a Home Valuation Report for This Property
The Home Valuation Report is an in-depth analysis detailing your home's value as well as a comparison with similar homes in the area
Home Values in the Area
Average Home Value in this Area
Purchase History
We collect this data history from publicly available records. To have your information removed, we recommend requesting removal directly through your county’s website.
| Date | Buyer | Sale Price | Title Company |
|---|---|---|---|
| Ulloa Jose Jaimes | -- | None Listed On Document | |
| Ulloa Baltazar Jaimes | -- | None Listed On Document | |
| Teague Craig William | -- | -- | |
| Teague Jack W | -- | Fnt | |
| Sutter James R | -- | Stewart Title |
Source: Public Records
Mortgage History
We collect this data history from publicly available records. To have your information removed, we recommend requesting removal directly through your county’s website.
| Date | Status | Borrower | Loan Amount |
|---|---|---|---|
| Previous Owner | Ulloa Baltazar Jaimes | $40,000 | |
| Previous Owner | Sutter James R | $103,200 |
Source: Public Records
Tax History
| Year | Tax Paid | Tax Assessment Tax Assessment Total Assessment is a certain percentage of the fair market value that is determined by local assessors to be the total taxable value of land and additions on the property. | Land | Improvement |
|---|---|---|---|---|
| 2025 | $7,752 | $338,666 | $85,000 | $253,666 |
| 2024 | $7,752 | $398,145 | $85,000 | $313,145 |
| 2023 | $7,207 | $375,754 | $60,000 | $315,754 |
| 2022 | $7,329 | $386,798 | $60,000 | $326,798 |
| 2021 | $7,186 | $309,315 | $60,000 | $249,315 |
| 2020 | $6,594 | $300,322 | $60,000 | $240,322 |
| 2019 | $6,125 | $302,260 | $60,000 | $242,260 |
| 2018 | $2,753 | $229,198 | $60,000 | $169,198 |
| 2017 | $5,041 | $257,683 | $40,000 | $217,683 |
| 2016 | $4,582 | $225,237 | $40,000 | $185,237 |
| 2015 | $2,791 | $172,200 | $25,000 | $147,200 |
| 2014 | $2,791 | $172,200 | $25,000 | $147,200 |
Source: Public Records
Map
Nearby Homes
- 1704 Saxon Dr
- 1609 Woodhill Ln
- 1800 Hampton Dr
- 17 Lincolnshire Cir
- 3017 Eagles Nest Dr
- 1925 Glenbrook Ct
- 2300 Ridgewood
- 2817 Downing Ct
- 1700 Wimbleton Dr
- 2232 Ridgewood
- 1804 Lincolnshire Dr
- 3804 Ashbury Ln
- 2577 Shady Ridge Dr
- 2032 Spicewood Rd
- 2518 Shady Ridge Dr
- 853 Spring Lake Dr
- 2108 Oakmeadow Place
- 2503 Shady Ridge Dr
- 2912 Weslyan Oak St
- 2109 Oakmeadow St
- 1620 Saxon Dr
- 1628 Saxon Dr
- 1641 Bedford Oaks Dr
- 1645 Bedford Oaks Dr
- 1632 Saxon Dr
- 1616 Saxon Dr
- 1649 Bedford Oaks Dr
- 1625 Saxon Dr
- 1621 Saxon Dr
- 1629 Saxon Dr
- 1700 Saxon Dr
- 1633 Bedford Oaks Dr
- 1612 Saxon Dr
- 1701 Bedford Oaks Ct
- 1633 Saxon Dr
- 1617 Saxon Dr
- 1700 Indian Oaks Ct
- 3301 Norman Ln
- 1629 Bedford Oaks Dr
- 1705 Oak Ln
Your Personal Tour Guide
Ask me questions while you tour the home.