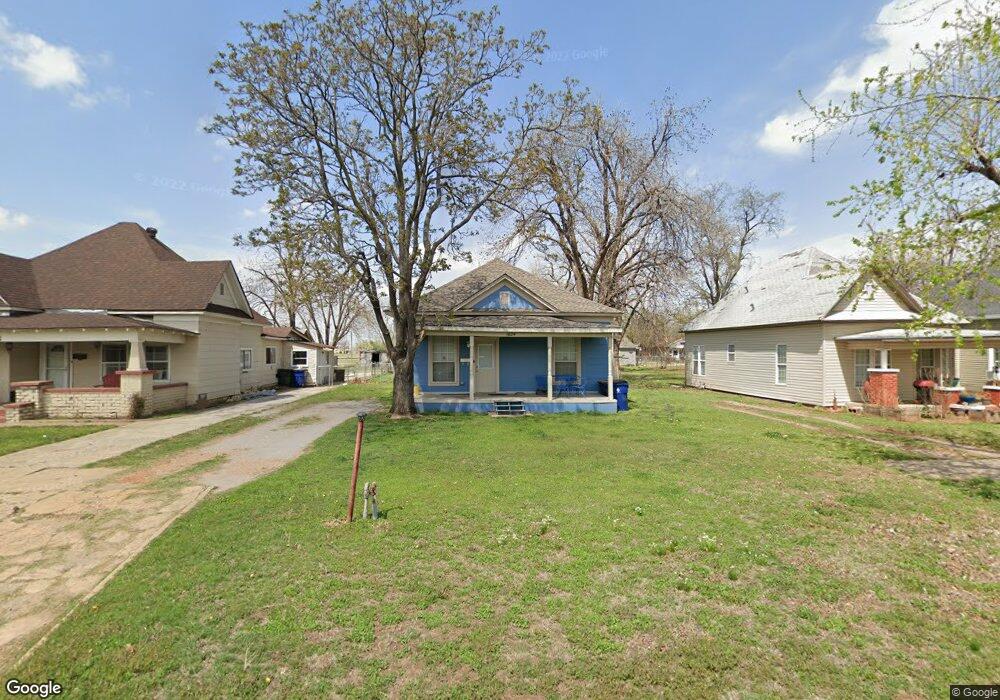
1624 W Minnesota Ave Chickasha, OK 73018
Estimated Value: $82,000 - $102,000
2
Beds
1
Bath
1,001
Sq Ft
$94/Sq Ft
Est. Value
About This Home
This home is located at 1624 W Minnesota Ave, Chickasha, OK 73018 and is currently estimated at $94,558, approximately $94 per square foot. 1624 W Minnesota Ave is a home located in Grady County with nearby schools including Grand Avenue Elementary School, Chickasha Middle School, and Lincoln Elementary School.
Ownership History
Date
Name
Owned For
Owner Type
Purchase Details
Closed on
Jun 6, 2005
Sold by
Trilogy Properties Llc
Bought by
Edwards Karen J
Current Estimated Value
Home Financials for this Owner
Home Financials are based on the most recent Mortgage that was taken out on this home.
Original Mortgage
$46,076
Outstanding Balance
$24,101
Interest Rate
5.79%
Mortgage Type
FHA
Estimated Equity
$70,457
Purchase Details
Closed on
Jan 13, 2005
Sold by
Goodall Steven John and Goodall Shelby L
Bought by
Trilogy Properties Llc
Purchase Details
Closed on
Dec 8, 2004
Sold by
Federal National Mort
Bought by
Goodall Steven John
Purchase Details
Closed on
Dec 6, 2004
Sold by
Weokie Credit Union
Bought by
Federal Nat'L Mtg Co
Purchase Details
Closed on
Aug 24, 2004
Sold by
Haynes David and Haynes Rose M
Bought by
Weokie Credit Union
Purchase Details
Closed on
Feb 28, 2003
Sold by
Wynott Jeffrey L and Wynott Kye
Bought by
Haynes David S
Create a Home Valuation Report for This Property
The Home Valuation Report is an in-depth analysis detailing your home's value as well as a comparison with similar homes in the area
Home Values in the Area
Average Home Value in this Area
Purchase History
| Date | Buyer | Sale Price | Title Company |
|---|---|---|---|
| Edwards Karen J | $47,000 | None Available | |
| Trilogy Properties Llc | -- | None Available | |
| Goodall Steven John | $25,000 | -- | |
| Federal Nat'L Mtg Co | -- | -- | |
| Weokie Credit Union | -- | -- | |
| Haynes David S | $38,000 | -- |
Source: Public Records
Mortgage History
| Date | Status | Borrower | Loan Amount |
|---|---|---|---|
| Open | Edwards Karen J | $46,076 |
Source: Public Records
Tax History Compared to Growth
Tax History
| Year | Tax Paid | Tax Assessment Tax Assessment Total Assessment is a certain percentage of the fair market value that is determined by local assessors to be the total taxable value of land and additions on the property. | Land | Improvement |
|---|---|---|---|---|
| 2024 | $276 | $3,721 | $871 | $2,850 |
| 2023 | $276 | $4,424 | $871 | $3,553 |
| 2022 | $347 | $4,336 | $871 | $3,465 |
| 2021 | $341 | $4,391 | $871 | $3,520 |
| 2020 | $347 | $4,369 | $871 | $3,498 |
| 2019 | $337 | $4,336 | $871 | $3,465 |
| 2018 | $347 | $4,369 | $871 | $3,498 |
| 2017 | $346 | $4,338 | $871 | $3,467 |
| 2016 | $354 | $4,393 | $871 | $3,522 |
| 2015 | $445 | $4,987 | $871 | $4,116 |
| 2014 | $445 | $5,251 | $871 | $4,380 |
Source: Public Records
Map
Nearby Homes
- 1512 W Iowa Ave
- 622 S 16th St
- 1528 W Idaho Ave
- 610 S 19th St
- 1310 W Minnesota Ave
- 1316 W Dakota Ave
- 1928 W Idaho Ave
- 2012 W Idaho Ave
- 1401 W Chickasha Ave
- 1123 W Kansas Ave
- 1028 S 16th St
- 828 S 12th St
- 1007 W Colorado Ave
- 1008 W Colorado Ave
- 1027 W Idaho Ave
- 1016 W Kansas Ave
- 909 W Minnesota Ave
- 1127 S 19th St
- 1124 S 19th St
- 925 W Chickasha Ave
- 1620 W Minnesota Ave
- 1628 W Minnesota Ave
- 1616 W Minnesota Ave
- 1702 W Minnesota Ave
- 1610 W Minnesota Ave
- 1625 W Iowa Ave
- 1623 W Iowa Ave
- 1619 W Iowa Ave
- 1627 W Iowa Ave
- 1602 W Minnesota Ave
- 1615 W Iowa Ave
- 1706 W Minnesota Ave
- 1619 W Minnesota Ave
- 1605 W Iowa Ave
- 1609 W Minnesota Ave
- 1601 W Iowa Ave
- 1714 W Minnesota Ave
- 1601 W Minnesota Ave
- 1528 W Minnesota Ave
- 514 S 17th St