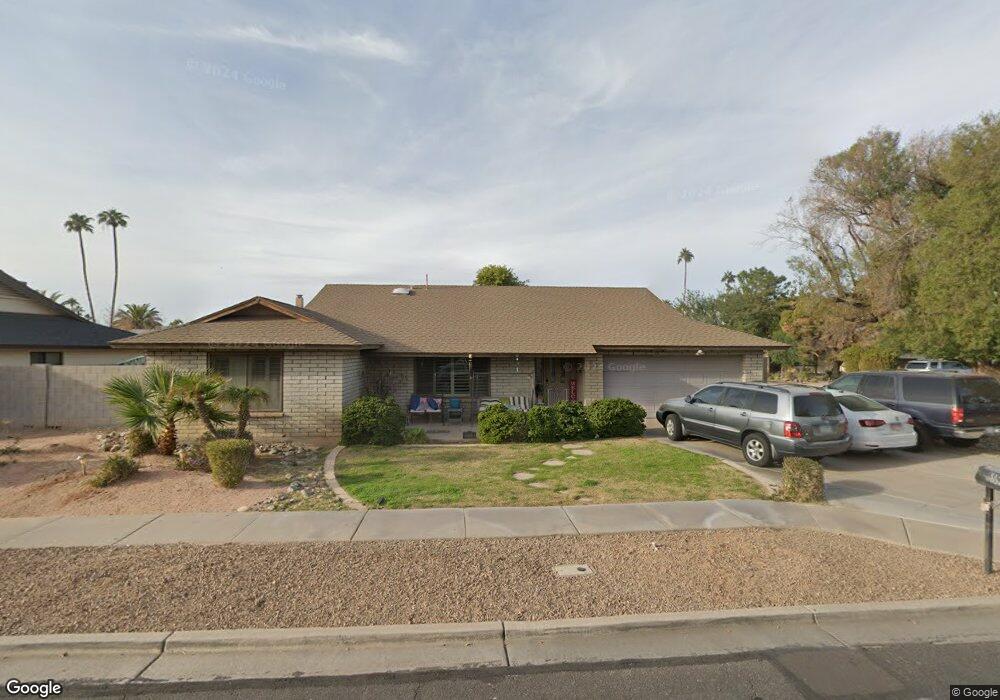
1624 W Nido Ave Mesa, AZ 85202
Dobson NeighborhoodEstimated Value: $422,071 - $529,000
--
Bed
2
Baths
1,799
Sq Ft
$275/Sq Ft
Est. Value
About This Home
This home is located at 1624 W Nido Ave, Mesa, AZ 85202 and is currently estimated at $494,018, approximately $274 per square foot. 1624 W Nido Ave is a home located in Maricopa County with nearby schools including Franklin at Brimhall Elementary School, Franklin Accelerated Academy Jordan Campus, and Washington Elementary School.
Ownership History
Date
Name
Owned For
Owner Type
Purchase Details
Closed on
Apr 21, 1998
Sold by
Jenkins Patricia A and Morrow Patricia A
Bought by
Jenkins Steven D and Jenkins Patricia A
Current Estimated Value
Home Financials for this Owner
Home Financials are based on the most recent Mortgage that was taken out on this home.
Original Mortgage
$130,000
Outstanding Balance
$28,064
Interest Rate
8.65%
Estimated Equity
$465,954
Purchase Details
Closed on
Jul 3, 1995
Sold by
Morrow Roy L
Bought by
Morrow Patricia A
Purchase Details
Closed on
Jul 25, 1994
Sold by
Dishroon Marlene
Bought by
Morrow Roy L
Home Financials for this Owner
Home Financials are based on the most recent Mortgage that was taken out on this home.
Original Mortgage
$91,000
Interest Rate
8.51%
Create a Home Valuation Report for This Property
The Home Valuation Report is an in-depth analysis detailing your home's value as well as a comparison with similar homes in the area
Home Values in the Area
Average Home Value in this Area
Purchase History
| Date | Buyer | Sale Price | Title Company |
|---|---|---|---|
| Jenkins Steven D | -- | Transnation Title Insurance | |
| Morrow Patricia A | -- | -- | |
| Morrow Roy L | -- | Fidelity Title |
Source: Public Records
Mortgage History
| Date | Status | Borrower | Loan Amount |
|---|---|---|---|
| Open | Jenkins Steven D | $130,000 | |
| Closed | Morrow Roy L | $91,000 |
Source: Public Records
Tax History Compared to Growth
Tax History
| Year | Tax Paid | Tax Assessment Tax Assessment Total Assessment is a certain percentage of the fair market value that is determined by local assessors to be the total taxable value of land and additions on the property. | Land | Improvement |
|---|---|---|---|---|
| 2025 | $1,650 | $19,867 | -- | -- |
| 2024 | $1,668 | $18,921 | -- | -- |
| 2023 | $1,668 | $37,000 | $7,400 | $29,600 |
| 2022 | $1,631 | $27,760 | $5,550 | $22,210 |
| 2021 | $1,676 | $25,630 | $5,120 | $20,510 |
| 2020 | $1,654 | $23,910 | $4,780 | $19,130 |
| 2019 | $1,532 | $22,320 | $4,460 | $17,860 |
| 2018 | $1,463 | $20,480 | $4,090 | $16,390 |
| 2017 | $1,417 | $19,210 | $3,840 | $15,370 |
| 2016 | $1,391 | $19,020 | $3,800 | $15,220 |
| 2015 | $1,313 | $17,180 | $3,430 | $13,750 |
Source: Public Records
Map
Nearby Homes
- 1639 W Nido Ave
- 2722 S Pennington
- 1555 W Naranja Ave
- 1531 W Naranja Ave
- 2524 S El Paradiso Unit 22
- 2524 S El Paradiso Unit 32
- 2524 S El Paradiso Unit 50
- 2406 S Mulberry
- 2741 S Brooks --
- 2637 S El Paradiso
- 1358 W Lobo Ave
- 1338 W Lobo Ave
- 2937 S Pennington
- 1910 W Onza Ave
- 2719 S Santa Barbara
- 2043 W Nopal Ave
- 1853 W Plata Ave
- 1651 W Lindner Ave
- 2958 S El Paradiso
- 1160 W Madero Cir
- 1632 W Nido Ave
- 1635 W Monte Ave
- 1625 W Nido Ave
- 1610 W Milagro Ave
- 1641 W Monte Ave
- 1613 W Nido Ave
- 1638 W Nido Ave
- 1614 W Milagro Ave
- 1633 W Nido Ave
- 1606 W Milagro Ave
- 1618 W Milagro Ave
- 1649 W Monte Ave
- 1646 W Nido Ave Unit 1
- 1640 W Monte Ave Unit 1
- 2620 S Longmore
- 1622 W Natal Ave
- 1614 W Natal Ave
- 1602 W Milagro Ave
- 1645 W Nido Ave
- 1624 W Milagro Ave