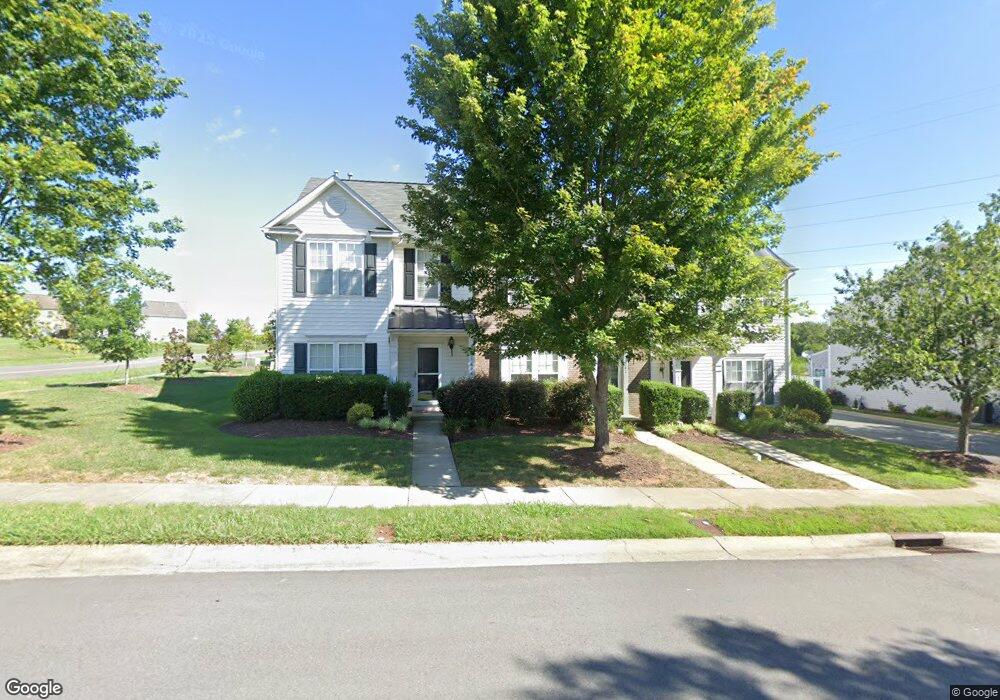
16242 Hayfield Rd Unit 16242 Charlotte, NC 28213
Estimated Value: $268,000 - $284,000
2
Beds
3
Baths
1,626
Sq Ft
$170/Sq Ft
Est. Value
About This Home
This home is located at 16242 Hayfield Rd Unit 16242, Charlotte, NC 28213 and is currently estimated at $276,677, approximately $170 per square foot. 16242 Hayfield Rd Unit 16242 is a home located in Cabarrus County with nearby schools including Harrisburg Elementary School, Hickory Ridge Middle, and Hickory Ridge High School.
Ownership History
Date
Name
Owned For
Owner Type
Purchase Details
Closed on
May 20, 2016
Sold by
Ford James T and Ford Wendy S
Bought by
Currie Barbara J and Currie John R
Current Estimated Value
Purchase Details
Closed on
Sep 28, 2009
Sold by
Napoletano Deborah A
Bought by
Ford James T and Ford Wendy S
Home Financials for this Owner
Home Financials are based on the most recent Mortgage that was taken out on this home.
Original Mortgage
$94,400
Interest Rate
5.11%
Mortgage Type
New Conventional
Purchase Details
Closed on
Sep 28, 2006
Sold by
Nvr Inc
Bought by
Napoletano Deborah
Home Financials for this Owner
Home Financials are based on the most recent Mortgage that was taken out on this home.
Original Mortgage
$13,026
Interest Rate
6.17%
Mortgage Type
Unknown
Purchase Details
Closed on
Jul 6, 2006
Sold by
Hinshaw Pearson Co
Bought by
Nvr Inc
Create a Home Valuation Report for This Property
The Home Valuation Report is an in-depth analysis detailing your home's value as well as a comparison with similar homes in the area
Home Values in the Area
Average Home Value in this Area
Purchase History
| Date | Buyer | Sale Price | Title Company |
|---|---|---|---|
| Currie Barbara J | $130,000 | None Available | |
| Ford James T | $118,000 | Bitmore Title | |
| Napoletano Deborah | $131,000 | None Available | |
| Nvr Inc | $67,500 | None Available |
Source: Public Records
Mortgage History
| Date | Status | Borrower | Loan Amount |
|---|---|---|---|
| Previous Owner | Ford James T | $94,400 | |
| Previous Owner | Napoletano Deborah | $13,026 | |
| Previous Owner | Napoletano Deborah | $104,608 |
Source: Public Records
Tax History Compared to Growth
Tax History
| Year | Tax Paid | Tax Assessment Tax Assessment Total Assessment is a certain percentage of the fair market value that is determined by local assessors to be the total taxable value of land and additions on the property. | Land | Improvement |
|---|---|---|---|---|
| 2025 | $2,370 | $240,340 | $70,000 | $170,340 |
| 2024 | $2,370 | $240,340 | $70,000 | $170,340 |
| 2023 | $1,861 | $158,420 | $40,000 | $118,420 |
| 2022 | $1,861 | $158,420 | $40,000 | $118,420 |
| 2021 | $867 | $158,420 | $40,000 | $118,420 |
| 2020 | $867 | $158,420 | $40,000 | $118,420 |
| 2019 | $1,201 | $109,640 | $15,000 | $94,640 |
| 2018 | $1,179 | $109,640 | $15,000 | $94,640 |
| 2017 | $1,085 | $109,640 | $15,000 | $94,640 |
| 2016 | $1,085 | $107,530 | $16,000 | $91,530 |
| 2015 | $753 | $107,530 | $16,000 | $91,530 |
| 2014 | $753 | $107,530 | $16,000 | $91,530 |
Source: Public Records
Map
Nearby Homes
- 4208 Coulter Crossing
- 4214 Coulter Crossing
- 4235 Coulter Crossing
- 5116 Sunburst Ln
- 440 Nathaniel Dale Place Unit BRX0041
- 437 Nathaniel Dale Place Unit BRX0034
- 429 Nathaniel Dale Place Unit BRX0032
- 408 Nathaniel Dale Place Unit BRX0053
- 412 Nathaniel Dale Place Unit BRX0052
- 6010 Albiza Dr
- 8915 Merrie Rose Ave
- 8015 Frances Haven Dr
- 3220 Barons Court Rd
- 1139 Grays Mill Rd
- 3414 Broadwick St
- 8320 Camelot Dr
- 8817 Arrington Hall
- 5730 Clear Creek Ln
- 8928 Morning Mist Rd
- 5840 Coulee Ln
- 16242 Hayfield Rd
- 16240 Hayfield Rd
- 16244 Hayfield Rd
- 16236 Hayfield Rd
- 16234 Hayfield Rd Unit 16234
- 16234 Hayfield Rd
- 16234 Hayfield Rd
- 16234 Hayfield Rd Unit 136
- 16232 Hayfield Rd
- 16230 Hayfield Rd
- 16230 Hayfield Rd Unit 138
- 4201 Coulter Crossing
- 16306 Hayfield Rd
- 4200 Coulter Crossing
- 4204 Coulter Crossing
- 4204 Coulter Crossing Unit 208
- 4202 Coulter Crossing
- 4203 Coulter Crossing
- 16314 Hayfield Rd
- 4205 Coulter Crossing