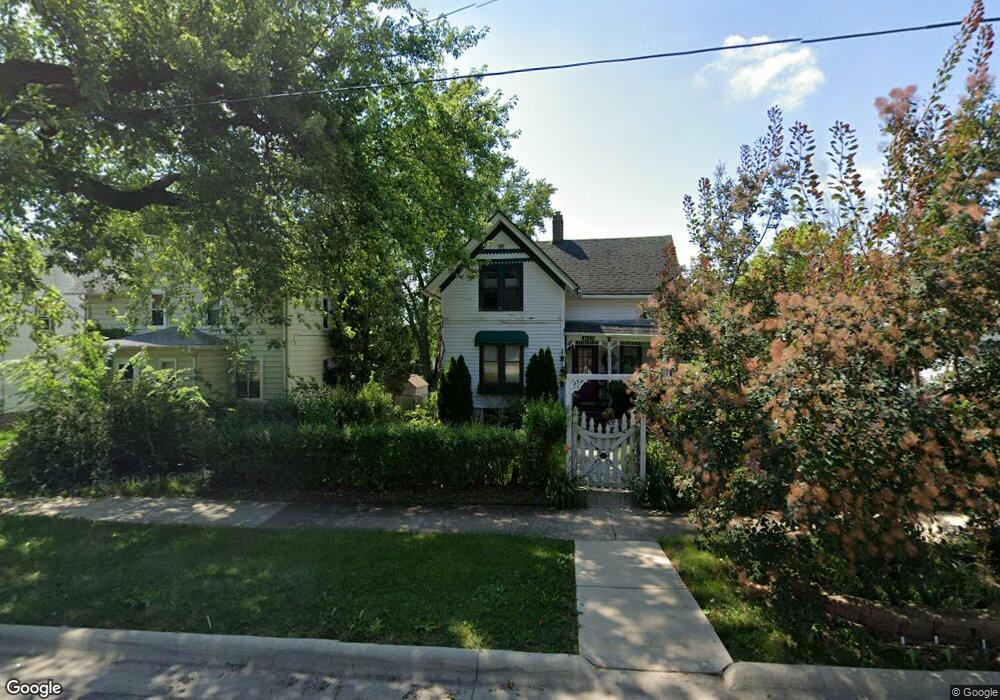
1625 5th Ave Rockford, IL 61104
Keith Creek NeighborhoodEstimated Value: $98,785 - $120,000
3
Beds
1
Bath
1,460
Sq Ft
$73/Sq Ft
Est. Value
About This Home
This home is located at 1625 5th Ave, Rockford, IL 61104 and is currently estimated at $106,946, approximately $73 per square foot. 1625 5th Ave is a home located in Winnebago County with nearby schools including Constance Lane Elementary School, Abraham Lincoln Middle School, and Rockford East High School.
Ownership History
Date
Name
Owned For
Owner Type
Purchase Details
Closed on
Dec 8, 2014
Sold by
Larson Ralph H
Bought by
Fritz Denise L
Current Estimated Value
Home Financials for this Owner
Home Financials are based on the most recent Mortgage that was taken out on this home.
Original Mortgage
$38,950
Outstanding Balance
$35,246
Interest Rate
5.75%
Mortgage Type
New Conventional
Estimated Equity
$71,700
Purchase Details
Closed on
May 21, 1993
Bought by
Fritz Denise
Create a Home Valuation Report for This Property
The Home Valuation Report is an in-depth analysis detailing your home's value as well as a comparison with similar homes in the area
Home Values in the Area
Average Home Value in this Area
Purchase History
| Date | Buyer | Sale Price | Title Company |
|---|---|---|---|
| Fritz Denise L | -- | -- | |
| Fritz Denise | $40,000 | -- |
Source: Public Records
Mortgage History
| Date | Status | Borrower | Loan Amount |
|---|---|---|---|
| Open | Fritz Denise L | $38,950 | |
| Closed | Fritz Denise L | $32,400 |
Source: Public Records
Tax History Compared to Growth
Tax History
| Year | Tax Paid | Tax Assessment Tax Assessment Total Assessment is a certain percentage of the fair market value that is determined by local assessors to be the total taxable value of land and additions on the property. | Land | Improvement |
|---|---|---|---|---|
| 2024 | $1,084 | $19,440 | $4,397 | $15,043 |
| 2023 | $949 | $17,141 | $3,877 | $13,264 |
| 2022 | $836 | $15,321 | $3,465 | $11,856 |
| 2021 | $741 | $14,048 | $3,177 | $10,871 |
| 2020 | $734 | $13,280 | $3,003 | $10,277 |
| 2019 | $764 | $12,657 | $2,862 | $9,795 |
| 2018 | $996 | $11,929 | $2,697 | $9,232 |
| 2017 | $846 | $11,416 | $2,581 | $8,835 |
| 2016 | $862 | $12,558 | $2,533 | $10,025 |
| 2015 | $1,179 | $12,558 | $2,533 | $10,025 |
| 2014 | $1,248 | $14,126 | $3,162 | $10,964 |
Source: Public Records
Map
Nearby Homes