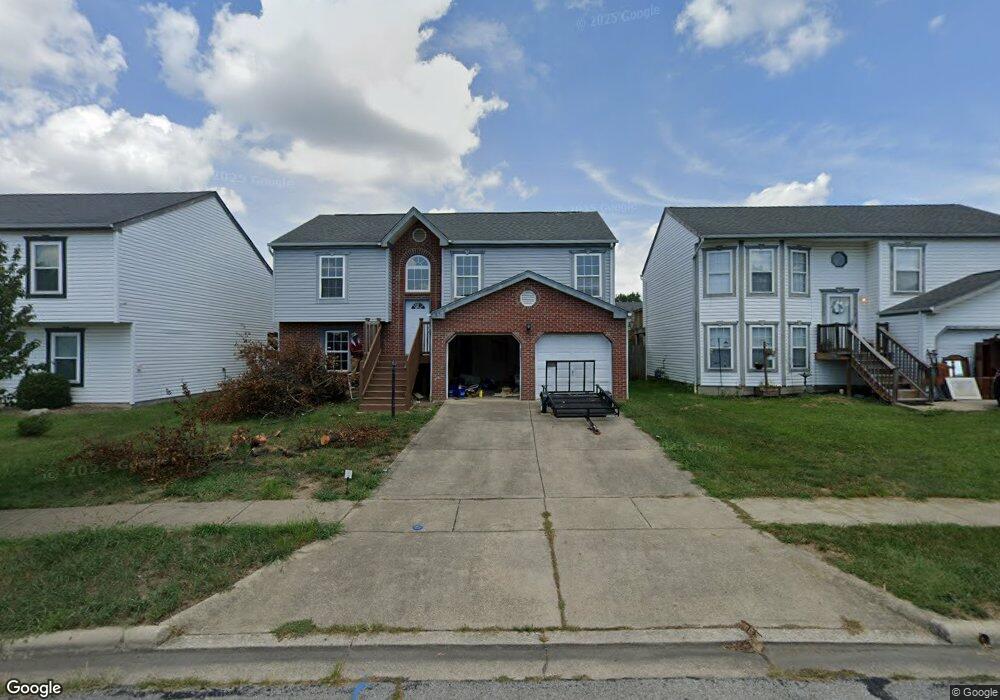
1625 Eastbrook Dr N Columbus, OH 43223
Estimated Value: $206,000 - $254,000
3
Beds
1
Bath
1,148
Sq Ft
$202/Sq Ft
Est. Value
About This Home
This home is located at 1625 Eastbrook Dr N, Columbus, OH 43223 and is currently estimated at $231,344, approximately $201 per square foot. 1625 Eastbrook Dr N is a home located in Franklin County with nearby schools including Finland Elementary School, Franklin Woods Intermediate School, and Finland Middle School.
Ownership History
Date
Name
Owned For
Owner Type
Purchase Details
Closed on
May 24, 2006
Sold by
Hud
Bought by
Padamadan Sydnie L and Padamadan Premy M
Current Estimated Value
Home Financials for this Owner
Home Financials are based on the most recent Mortgage that was taken out on this home.
Original Mortgage
$62,500
Outstanding Balance
$36,774
Interest Rate
6.68%
Mortgage Type
Purchase Money Mortgage
Estimated Equity
$194,570
Purchase Details
Closed on
May 23, 2005
Sold by
Horner Timothy D and Us Bank Na
Bought by
Hud
Purchase Details
Closed on
Nov 15, 2000
Sold by
Maronda Homes Inc Of Ohio
Bought by
Horner Timothy D and Horner Benjamin Kimberly
Home Financials for this Owner
Home Financials are based on the most recent Mortgage that was taken out on this home.
Original Mortgage
$104,192
Interest Rate
7.87%
Mortgage Type
FHA
Create a Home Valuation Report for This Property
The Home Valuation Report is an in-depth analysis detailing your home's value as well as a comparison with similar homes in the area
Home Values in the Area
Average Home Value in this Area
Purchase History
| Date | Buyer | Sale Price | Title Company |
|---|---|---|---|
| Padamadan Sydnie L | $95,000 | Valmer | |
| Hud | $76,000 | -- | |
| Horner Timothy D | $105,100 | -- |
Source: Public Records
Mortgage History
| Date | Status | Borrower | Loan Amount |
|---|---|---|---|
| Open | Padamadan Sydnie L | $62,500 | |
| Previous Owner | Horner Timothy D | $104,192 |
Source: Public Records
Tax History Compared to Growth
Tax History
| Year | Tax Paid | Tax Assessment Tax Assessment Total Assessment is a certain percentage of the fair market value that is determined by local assessors to be the total taxable value of land and additions on the property. | Land | Improvement |
|---|---|---|---|---|
| 2024 | $2,973 | $79,490 | $19,430 | $60,060 |
| 2023 | $2,921 | $79,485 | $19,425 | $60,060 |
| 2022 | $2,640 | $52,710 | $8,750 | $43,960 |
| 2021 | $2,692 | $52,710 | $8,750 | $43,960 |
| 2020 | $2,679 | $52,710 | $8,750 | $43,960 |
| 2019 | $2,456 | $42,630 | $7,000 | $35,630 |
| 2018 | $2,495 | $42,630 | $7,000 | $35,630 |
| 2017 | $2,334 | $42,630 | $7,000 | $35,630 |
| 2016 | $2,230 | $35,840 | $4,900 | $30,940 |
| 2015 | $2,268 | $35,840 | $4,900 | $30,940 |
| 2014 | $2,232 | $35,840 | $4,900 | $30,940 |
| 2013 | $1,165 | $37,695 | $5,145 | $32,550 |
Source: Public Records
Map
Nearby Homes
- 1417 Fahy Dr
- 1607 Red Leaf Ln
- 1543 Red Leaf Ln
- 1390 Gray Meadow Dr
- 2210 October Ridge Dr
- 1723 Farberdale Dr
- 1659 Westmeadow Dr
- 0 S Central Ave
- 1994 Little Ave
- 1532 Westmeadow Dr
- 1948 Big Run Bluffs Blvd
- 1949 Big Run Bluffs Blvd
- 1417 Brown Rd
- 1258 Woodbrook Cir W Unit 199
- 1663 Hopkins Ave
- 2180 Eakin Rd
- 2336 Woodbrook Cir N Unit 92 B
- 1757 Linnet Ave
- 1540 Little Ave
- 2362 Woodbrook Cir N Unit 81
- 1619 Eastbrook Dr N
- 1631 Eastbrook Dr N
- 1637 Eastbrook Dr N
- 1611 Eastbrook Dr N
- 1929 Little Water Dr
- 1947 Little Water Dr
- 1923 Little Water Dr
- 1624 Eastbrook Dr N
- 1632 Eastbrook Dr N
- 1643 Eastbrook Dr N
- 1616 Eastbrook Dr N
- 1953 Little Water Dr
- 1646 Eastbrook Dr N
- 1894 Saint Lawrence Dr
- 1888 Saint Lawrence Dr
- 1655 Eastbrook Dr N
- 1649 Eastbrook Dr N
- 1882 Saint Lawrence Dr
- 1900 Saint Lawrence Dr
- 1658 Eastbrook Dr N