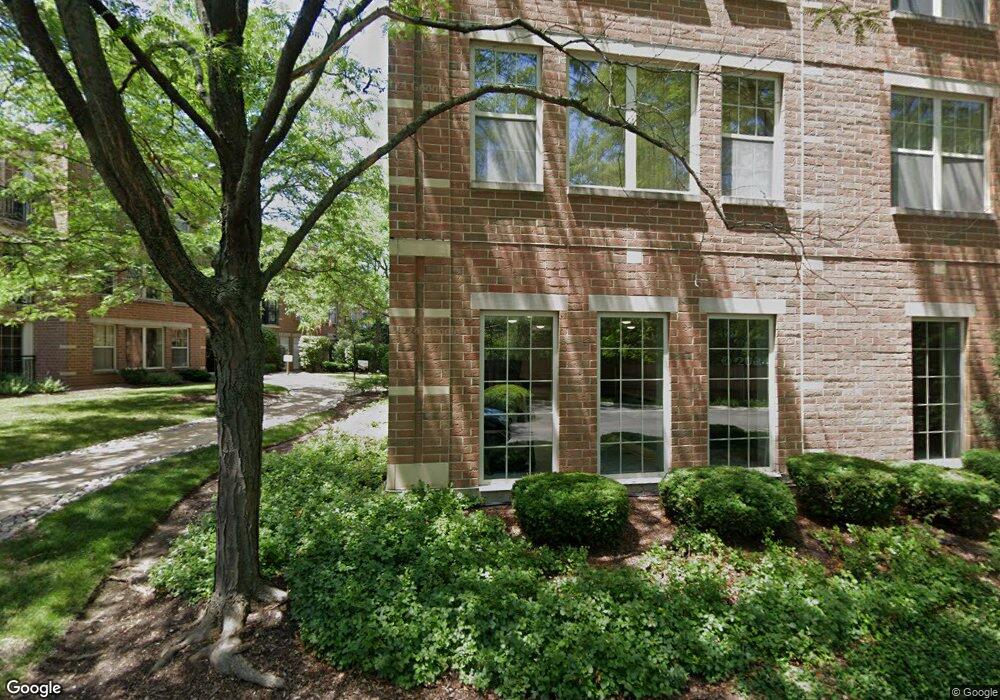
1625 Glenview Rd Unit 209 Glenview, IL 60025
Estimated Value: $439,000 - $511,000
2
Beds
--
Bath
157,888
Sq Ft
$3/Sq Ft
Est. Value
About This Home
This home is located at 1625 Glenview Rd Unit 209, Glenview, IL 60025 and is currently estimated at $469,923, approximately $2 per square foot. 1625 Glenview Rd Unit 209 is a home located in Cook County with nearby schools including Lyon Elementary School, Pleasant Ridge Elementary School, and Springman Middle School.
Ownership History
Date
Name
Owned For
Owner Type
Purchase Details
Closed on
Mar 1, 2018
Sold by
Offen Beverly and Drick Beverly
Bought by
Lynk Paulinda G and Paulinda G Lynk Declaration Of
Current Estimated Value
Purchase Details
Closed on
Jul 26, 2002
Sold by
Pearson Harry A and Pearson Mary E C
Bought by
Offen Ronald C and Drick Beverly
Home Financials for this Owner
Home Financials are based on the most recent Mortgage that was taken out on this home.
Original Mortgage
$220,000
Interest Rate
6.7%
Purchase Details
Closed on
Nov 17, 2000
Sold by
Lasalle Bank National Assn
Bought by
Pearson Harry A and Corrigan Mary E
Home Financials for this Owner
Home Financials are based on the most recent Mortgage that was taken out on this home.
Original Mortgage
$260,000
Interest Rate
7.37%
Create a Home Valuation Report for This Property
The Home Valuation Report is an in-depth analysis detailing your home's value as well as a comparison with similar homes in the area
Home Values in the Area
Average Home Value in this Area
Purchase History
| Date | Buyer | Sale Price | Title Company |
|---|---|---|---|
| Lynk Paulinda G | $385,000 | Chicago Title | |
| Offen Ronald C | $416,500 | -- | |
| Pearson Harry A | $359,500 | First American Title |
Source: Public Records
Mortgage History
| Date | Status | Borrower | Loan Amount |
|---|---|---|---|
| Previous Owner | Offen Ronald C | $220,000 | |
| Previous Owner | Pearson Harry A | $260,000 |
Source: Public Records
Tax History Compared to Growth
Tax History
| Year | Tax Paid | Tax Assessment Tax Assessment Total Assessment is a certain percentage of the fair market value that is determined by local assessors to be the total taxable value of land and additions on the property. | Land | Improvement |
|---|---|---|---|---|
| 2024 | $6,216 | $34,055 | $2,769 | $31,286 |
| 2023 | $6,000 | $34,055 | $2,769 | $31,286 |
| 2022 | $6,000 | $34,055 | $2,769 | $31,286 |
| 2021 | $5,675 | $28,795 | $2,076 | $26,719 |
| 2020 | $5,709 | $28,795 | $2,076 | $26,719 |
| 2019 | $5,312 | $31,638 | $2,076 | $29,562 |
| 2018 | $6,248 | $33,348 | $1,817 | $31,531 |
| 2017 | $6,105 | $33,348 | $1,817 | $31,531 |
| 2016 | $7,054 | $33,348 | $1,817 | $31,531 |
| 2015 | $5,318 | $26,828 | $1,470 | $25,358 |
| 2014 | $5,242 | $26,828 | $1,470 | $25,358 |
| 2013 | $5,059 | $26,828 | $1,470 | $25,358 |
Source: Public Records
Map
Nearby Homes
- 1800 Dewes St Unit 305
- 1800 Dewes St Unit 201
- 713 Carriage Hill Dr
- 711 Carriage Hill Dr
- 1752 Maclean Ct
- 609 Carriage Hill Dr
- 601 Carriage Hill Dr
- 1220 Depot St Unit 305
- 1220 Depot St Unit 109
- 1220 Depot St Unit 409
- 1342 Pine St
- 1821 George Ct
- 1123 Longvalley Rd
- 1121 Longvalley Rd
- 1341 Greenwillow Ln Unit C
- 1429 Pebblecreek Dr Unit 171
- 2137 Glenview Rd
- 809 Lenox Rd
- 1508 Pebblecreek Dr Unit 14
- 1625 Glenview Rd Unit 108
- 1625 Glenview Rd Unit 301
- 1625 Glenview Rd Unit 302
- 1625 Glenview Rd Unit 306
- 1625 Glenview Rd Unit 303
- 1625 Glenview Rd Unit 107
- 1625 Glenview Rd Unit 213
- 1625 Glenview Rd Unit 206
- 1625 Glenview Rd Unit 214
- 1625 Glenview Rd Unit 102
- 1625 Glenview Rd Unit 101
- 1625 Glenview Rd Unit 211
- 1625 Glenview Rd Unit 103
- 1625 Glenview Rd Unit 105
- 1625 Glenview Rd Unit 104
- 1625 Glenview Rd Unit 106
- 1625 Glenview Rd Unit 204
- 1625 Glenview Rd Unit 201
- 1625 Glenview Rd Unit 305
- 1625 Glenview Rd Unit 310