Estimated Value: $92,000 - $139,000
2
Beds
1
Bath
668
Sq Ft
$162/Sq Ft
Est. Value
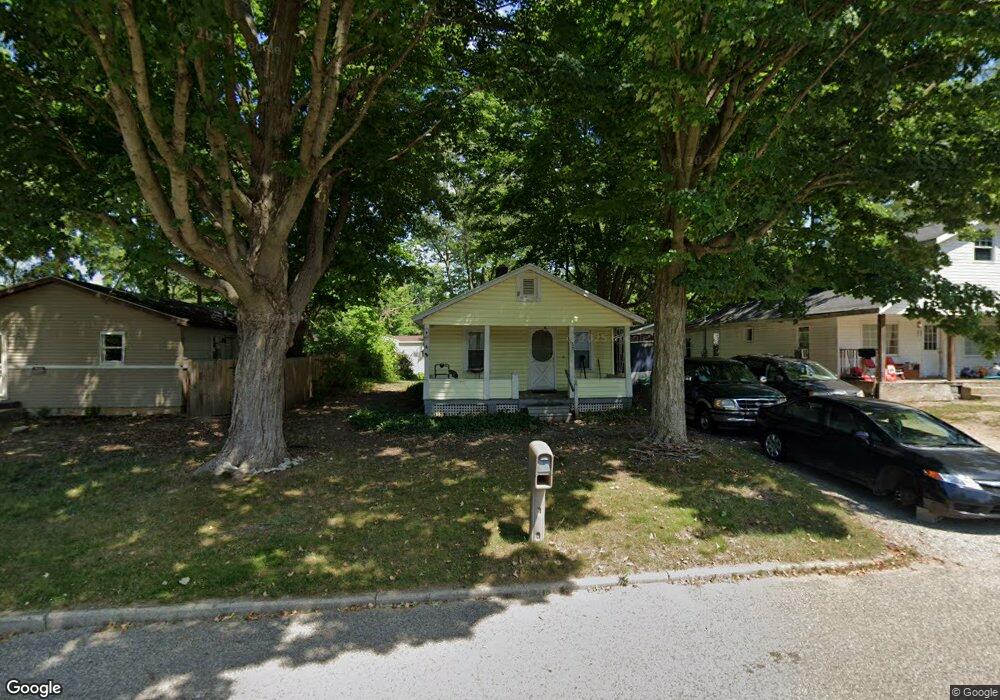
About This Home
This home is located at 1625 Huron St, Niles, MI 49120 and is currently estimated at $108,444, approximately $162 per square foot. 1625 Huron St is a home located in Berrien County with nearby schools including James Ellis School, Howard-Ellis Elementary School, and Oak Manor Sixth Grade Center.
Ownership History
Date
Name
Owned For
Owner Type
Purchase Details
Closed on
Aug 13, 2021
Sold by
Smith Kathleen M
Bought by
Fitch James F and Fitch Nancy Jean
Current Estimated Value
Purchase Details
Closed on
Sep 27, 2019
Sold by
Smith Kathleen M
Bought by
Dillman Frances May
Purchase Details
Closed on
Sep 19, 2019
Sold by
Estate Of Frances May Dillman
Bought by
Smith Kathleen M
Purchase Details
Closed on
Dec 17, 2015
Sold by
Estate Of Frances May Dillman
Bought by
Fitch James F and Fitch Nancy Jean
Create a Home Valuation Report for This Property
The Home Valuation Report is an in-depth analysis detailing your home's value as well as a comparison with similar homes in the area
Home Values in the Area
Average Home Value in this Area
Purchase History
| Date | Buyer | Sale Price | Title Company |
|---|---|---|---|
| Fitch James F | $22,000 | Mollison Law Office | |
| Dillman Frances May | -- | None Listed On Document | |
| Smith Kathleen M | -- | None Available | |
| Fitch James F | $22,000 | Attorney |
Source: Public Records
Tax History
| Year | Tax Paid | Tax Assessment Tax Assessment Total Assessment is a certain percentage of the fair market value that is determined by local assessors to be the total taxable value of land and additions on the property. | Land | Improvement |
|---|---|---|---|---|
| 2025 | $1,127 | $35,000 | $0 | $0 |
| 2024 | $588 | $31,900 | $0 | $0 |
| 2023 | $563 | $27,900 | $0 | $0 |
| 2022 | $536 | $26,100 | $0 | $0 |
| 2021 | $983 | $24,300 | $3,100 | $21,200 |
| 2020 | $972 | $18,800 | $0 | $0 |
| 2019 | $958 | $23,500 | $8,500 | $15,000 |
| 2018 | $923 | $23,500 | $0 | $0 |
| 2017 | $913 | $17,700 | $0 | $0 |
| 2016 | $897 | $15,900 | $0 | $0 |
| 2015 | $433 | $14,800 | $0 | $0 |
| 2014 | $328 | $14,800 | $0 | $0 |
Source: Public Records
Map
Nearby Homes
- 1638 Superior St
- 324 S 15th St
- 0 S 15th St
- V/L S 15th St
- 1408 Silverbrook Ave
- 2112 Kathryn Dr
- 1451 Cedar St
- V/L Kathryn St Unit Tract 3
- 1648 Oak St
- 2451 Spansail Dr
- 0 Kathryn St Unit Tract 1
- 920 Cherry St
- 1008 Oak St
- 17 S 10th St
- 1314 Ferry St
- 400 Carefree Ct
- 607 N 18th St
- 319 S 5th St
- 718 Regent St
- 300 Carefree Ct
Your Personal Tour Guide
Ask me questions while you tour the home.