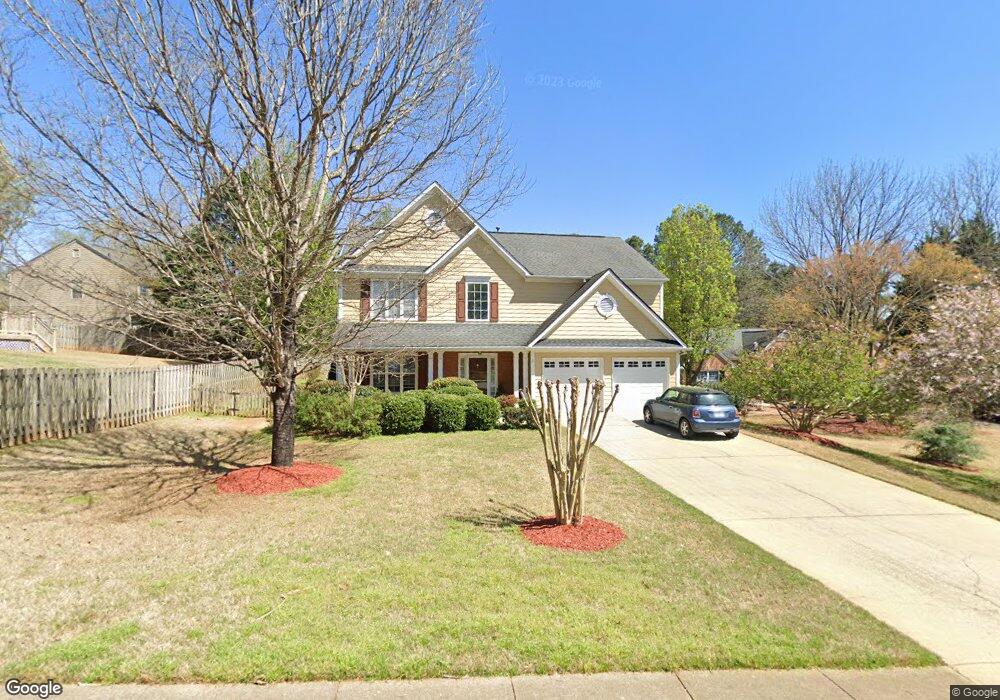
1625 Midland Ct Alpharetta, GA 30004
Estimated Value: $562,800 - $578,000
4
Beds
3
Baths
2,122
Sq Ft
$267/Sq Ft
Est. Value
About This Home
This home is located at 1625 Midland Ct, Alpharetta, GA 30004 and is currently estimated at $567,450, approximately $267 per square foot. 1625 Midland Ct is a home located in Forsyth County with nearby schools including Brandywine Elementary School, DeSana Middle School, and Denmark High School.
Ownership History
Date
Name
Owned For
Owner Type
Purchase Details
Closed on
Jan 29, 2018
Sold by
Severit Sheila D
Bought by
Lancaster Sheila D
Current Estimated Value
Home Financials for this Owner
Home Financials are based on the most recent Mortgage that was taken out on this home.
Original Mortgage
$155,000
Outstanding Balance
$110,127
Interest Rate
3.99%
Mortgage Type
New Conventional
Estimated Equity
$457,323
Purchase Details
Closed on
Apr 16, 2004
Sold by
Midland Court Trust
Bought by
Severit Sheila D
Home Financials for this Owner
Home Financials are based on the most recent Mortgage that was taken out on this home.
Original Mortgage
$166,400
Interest Rate
4%
Mortgage Type
New Conventional
Purchase Details
Closed on
Nov 25, 2001
Sold by
Barker Chad J
Bought by
Midland Court Trust
Purchase Details
Closed on
Sep 13, 2000
Sold by
Yao Alex
Bought by
Barker Chad J
Create a Home Valuation Report for This Property
The Home Valuation Report is an in-depth analysis detailing your home's value as well as a comparison with similar homes in the area
Home Values in the Area
Average Home Value in this Area
Purchase History
| Date | Buyer | Sale Price | Title Company |
|---|---|---|---|
| Lancaster Sheila D | -- | -- | |
| Severit Sheila D | $208,000 | -- | |
| Midland Court Trust | -- | -- | |
| Barker Chad J | -- | -- |
Source: Public Records
Mortgage History
| Date | Status | Borrower | Loan Amount |
|---|---|---|---|
| Open | Lancaster Sheila D | $155,000 | |
| Previous Owner | Severit Sheila D | $166,400 | |
| Previous Owner | Severit Sheila D | $20,800 |
Source: Public Records
Tax History Compared to Growth
Tax History
| Year | Tax Paid | Tax Assessment Tax Assessment Total Assessment is a certain percentage of the fair market value that is determined by local assessors to be the total taxable value of land and additions on the property. | Land | Improvement |
|---|---|---|---|---|
| 2025 | $4,913 | $205,556 | $68,000 | $137,556 |
| 2024 | $4,913 | $200,356 | $68,000 | $132,356 |
| 2023 | $4,495 | $182,624 | $60,000 | $122,624 |
| 2022 | $3,770 | $117,352 | $40,000 | $77,352 |
| 2021 | $3,241 | $117,352 | $40,000 | $77,352 |
| 2020 | $3,149 | $114,052 | $40,000 | $74,052 |
| 2019 | $3,114 | $112,596 | $40,000 | $72,596 |
| 2018 | $2,747 | $99,336 | $32,000 | $67,336 |
| 2017 | $2,528 | $91,084 | $32,000 | $59,084 |
| 2016 | $2,229 | $80,324 | $24,000 | $56,324 |
| 2015 | $2,178 | $78,324 | $22,000 | $56,324 |
| 2014 | -- | $71,308 | $22,000 | $49,308 |
Source: Public Records
Map
Nearby Homes
- 1405 Overland Crossing
- 1245 Overland Crossing
- 1570 Winshire Cove
- 1255 Faircrest Crossing Dr
- 1620 Woodall View Ct
- 1615 Waverly Glen Dr
- 550 Central Park Overlook
- 845 Miranda Terrace
- 255 White Pines Dr
- 6425 Halcyon Way
- 923 Prestwyck Ct
- 1035 Prestwyck Ct
- 1030 Prestwyck Ct Unit 1030
- 390 Tidwell Rd
- 1465 Queens Ln
- 840 Central Park Overlook
- 7330 Winthrop Rd
- 860 Hargrove Point Way
- 1040 Peyton View Ct
- 1650 Township Cir
- 1635 Midland Ct
- 1525 Overland Crossing
- 1535 Overland Crossing
- 1520 Fairwind Ct
- 1510 Fairwind Ct
- 1645 Midland Ct
- 1530 Fairwind Ct
- 1620 Midland Ct
- 1630 Midland Ct
- 1655 Midland Ct
- 1540 Fairwind Ct
- 1640 Midland Ct
- 1520 Overland Crossing
- 1530 Overland Crossing
- 1650 Midland Ct
- 1650 Midland Ct
- 1540 Overland Crossing
- 1610 Overland Crossing
- 1645 Overland Crossing
- 1735 Fireside Place