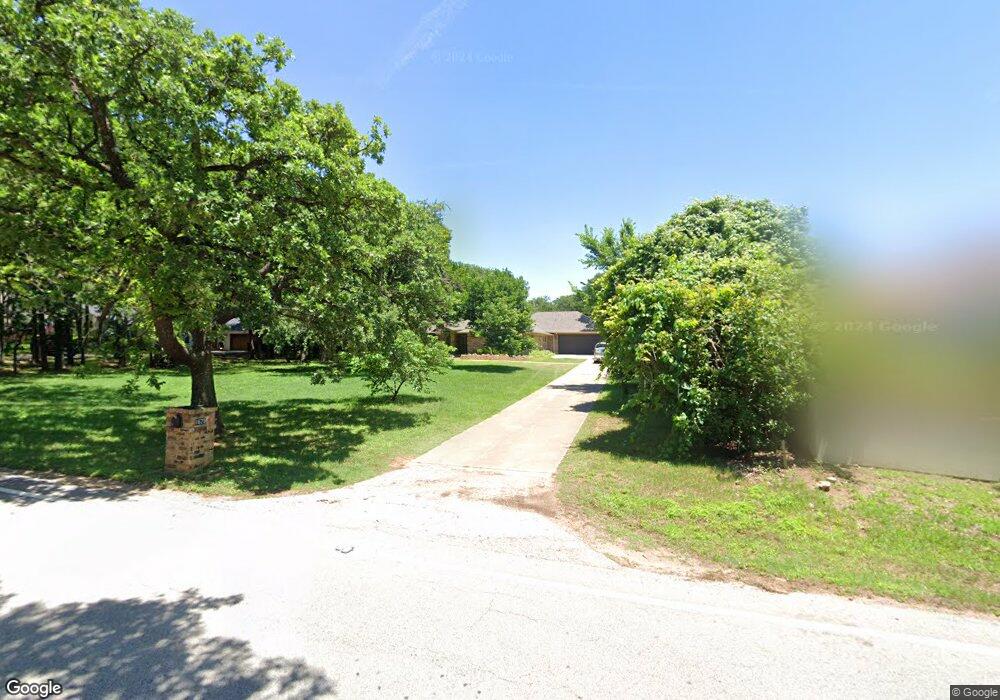
1625 Randol Mill Ave Southlake, TX 76092
Estimated Value: $1,100,000 - $1,568,000
3
Beds
3
Baths
3,041
Sq Ft
$429/Sq Ft
Est. Value
About This Home
This home is located at 1625 Randol Mill Ave, Southlake, TX 76092 and is currently estimated at $1,304,013, approximately $428 per square foot. 1625 Randol Mill Ave is a home located in Tarrant County with nearby schools including Walnut Grove Elementary School, Don T. Durham Intermediate School, and Carroll Middle School.
Ownership History
Date
Name
Owned For
Owner Type
Purchase Details
Closed on
May 8, 2023
Sold by
Bailey H Shepard H and Bailey Tammi L
Bought by
Shep And Tammi Bailey Revocable Trust
Current Estimated Value
Purchase Details
Closed on
Aug 11, 2017
Sold by
Clayton Don S and Clayton Donna B
Bought by
Bailey Bailey H and Bailey Tammi L
Home Financials for this Owner
Home Financials are based on the most recent Mortgage that was taken out on this home.
Original Mortgage
$399,000
Interest Rate
3.88%
Mortgage Type
New Conventional
Purchase Details
Closed on
Sep 19, 1997
Sold by
Vogt Randall Terry and Vogt Debra Newman
Bought by
Clayton Don S and Clayton Donna B
Home Financials for this Owner
Home Financials are based on the most recent Mortgage that was taken out on this home.
Original Mortgage
$178,100
Interest Rate
7.56%
Create a Home Valuation Report for This Property
The Home Valuation Report is an in-depth analysis detailing your home's value as well as a comparison with similar homes in the area
Home Values in the Area
Average Home Value in this Area
Purchase History
| Date | Buyer | Sale Price | Title Company |
|---|---|---|---|
| Shep And Tammi Bailey Revocable Trust | -- | None Listed On Document | |
| Bailey Bailey H | -- | None Available | |
| Clayton Don S | -- | American Title Co |
Source: Public Records
Mortgage History
| Date | Status | Borrower | Loan Amount |
|---|---|---|---|
| Previous Owner | Bailey Bailey H | $399,000 | |
| Previous Owner | Clayton Don S | $178,100 |
Source: Public Records
Tax History Compared to Growth
Tax History
| Year | Tax Paid | Tax Assessment Tax Assessment Total Assessment is a certain percentage of the fair market value that is determined by local assessors to be the total taxable value of land and additions on the property. | Land | Improvement |
|---|---|---|---|---|
| 2025 | $18,495 | $1,057,464 | $517,170 | $540,294 |
| 2024 | $18,495 | $1,057,464 | $517,170 | $540,294 |
| 2023 | $19,178 | $1,052,166 | $517,170 | $534,996 |
| 2022 | $12,884 | $597,193 | $368,475 | $228,718 |
| 2021 | $13,655 | $598,894 | $368,475 | $230,419 |
| 2020 | $13,731 | $597,374 | $438,255 | $159,119 |
| 2019 | $16,350 | $675,213 | $438,255 | $236,958 |
| 2018 | $15,273 | $630,733 | $438,255 | $192,478 |
| 2017 | $8,536 | $472,062 | $243,475 | $228,587 |
| 2016 | $7,760 | $456,904 | $243,475 | $213,429 |
| 2015 | $6,783 | $284,600 | $100,000 | $184,600 |
| 2014 | $6,783 | $284,600 | $100,000 | $184,600 |
Source: Public Records
Map
Nearby Homes
- 1720 Maranatha Way
- 1705 Maranatha Way
- 1711 Maranatha Way
- 1820 Beam Dr
- 1502 Bluffview Dr
- 1121 Post Oak Place
- 1117 Post Oak Place
- 1521 Meandering Way Dr
- 1600 Enclave Ct
- 1110 Post Oak Place
- 1403 Fountain Grass Ct
- 1371 Holland Hill
- 1567 Dove Rd
- 2350 Fawkes Ln
- 2009 Montecito Trail
- 1500 Wills Ct
- 1609 Meandering Way Dr
- 1633 Mockingbird Ln
- 1425 N Peytonville Ave
- 904 Palos Verdes Trail
- 1665 Randol Mill Ave
- 1615 Randol Mill Ave
- 1701 Randol Mill Ave
- 1595 Randol Mill Ave
- 1600 Randol Mill Ave
- 1650 Randol Mill Ave
- 2006 Morgan Rd
- 2004 Morgan Rd
- 1591 Randol Mill Ave
- 2000 Morgan Rd
- 1590 Randol Mill Ave
- 2010 Morgan Rd
- 1730 Randol Mill Ave
- 1700 Randol Mill Ave
- 1720 Randol Mill Ave
- 1589 Randol Mill Ave
- 2012 Morgan Rd
- 1740 Randol Mill Ave
- 1584 Randol Mill Ave
- 1712 Randol Mill Ave