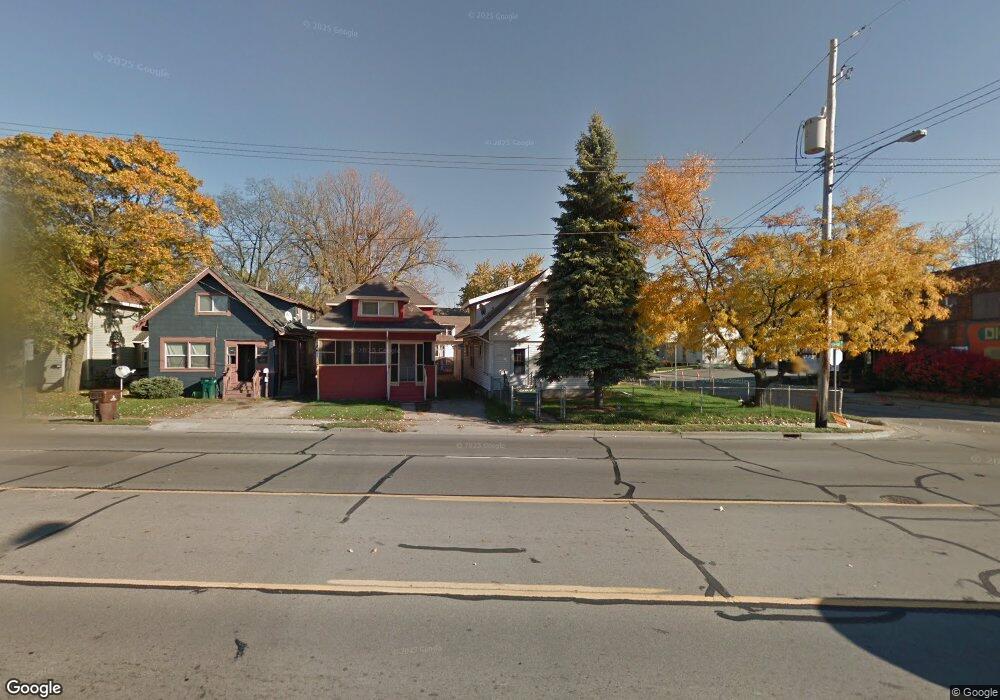
1625 S Cedar St Lansing, MI 48910
Fabulous Acres NeighborhoodEstimated Value: $105,000 - $114,676
4
Beds
2
Baths
1,441
Sq Ft
$75/Sq Ft
Est. Value
About This Home
This home is located at 1625 S Cedar St, Lansing, MI 48910 and is currently estimated at $108,669, approximately $75 per square foot. 1625 S Cedar St is a home located in Ingham County with nearby schools including Lyons Elementary School, Pattengill Academy, and Eastern High School.
Ownership History
Date
Name
Owned For
Owner Type
Purchase Details
Closed on
Feb 28, 2012
Sold by
Schneider Brett N
Bought by
Martinez Jose Angel
Current Estimated Value
Purchase Details
Closed on
Aug 4, 2010
Sold by
Schneider Jill M and Schneider Clifton B
Bought by
Schneider Brett N
Purchase Details
Closed on
Jan 14, 2005
Sold by
Estate Of Harold Burley
Bought by
Fineout Jill M and Schneider Clifton B
Home Financials for this Owner
Home Financials are based on the most recent Mortgage that was taken out on this home.
Original Mortgage
$74,700
Interest Rate
4.37%
Mortgage Type
Purchase Money Mortgage
Create a Home Valuation Report for This Property
The Home Valuation Report is an in-depth analysis detailing your home's value as well as a comparison with similar homes in the area
Home Values in the Area
Average Home Value in this Area
Purchase History
| Date | Buyer | Sale Price | Title Company |
|---|---|---|---|
| Martinez Jose Angel | $15,000 | None Available | |
| Schneider Brett N | $68,000 | First American Title Ins Co | |
| Fineout Jill M | $83,000 | Fatic |
Source: Public Records
Mortgage History
| Date | Status | Borrower | Loan Amount |
|---|---|---|---|
| Previous Owner | Fineout Jill M | $74,700 |
Source: Public Records
Tax History Compared to Growth
Tax History
| Year | Tax Paid | Tax Assessment Tax Assessment Total Assessment is a certain percentage of the fair market value that is determined by local assessors to be the total taxable value of land and additions on the property. | Land | Improvement |
|---|---|---|---|---|
| 2025 | $1,770 | $51,100 | $2,900 | $48,200 |
| 2024 | $14 | $39,000 | $2,900 | $36,100 |
| 2023 | $1,662 | $34,600 | $2,900 | $31,700 |
| 2022 | $1,502 | $32,200 | $2,500 | $29,700 |
| 2021 | $1,471 | $28,500 | $2,300 | $26,200 |
| 2020 | $1,462 | $26,500 | $2,300 | $24,200 |
| 2019 | $1,399 | $24,000 | $2,300 | $21,700 |
| 2018 | $1,314 | $21,900 | $2,300 | $19,600 |
| 2017 | $1,257 | $21,900 | $2,300 | $19,600 |
| 2016 | $1,230 | $21,500 | $2,300 | $19,200 |
| 2015 | $1,230 | $20,900 | $4,549 | $16,351 |
| 2014 | $1,230 | $21,100 | $3,457 | $17,643 |
Source: Public Records
Map
Nearby Homes
- 1731 Herbert St
- 1818 Ray St
- 531 Torrence Ct
- 1800 Herbert St
- 1539 Linval St
- 525 E Mount Hope Ave
- 147 Isbell St
- 515 Jason Ct
- 707 Isbell St
- 506 Christiancy St
- 1927 Teel Ave
- 1722 S Washington Ave
- 704 Mckim Ave
- 1437 Ada St
- 2107 Teel Ave
- 520 Riley St
- 139 Woodlawn Ave
- 202 Woodlawn Ave
- 1408 Reo Ave
- 1406 Reo Ave