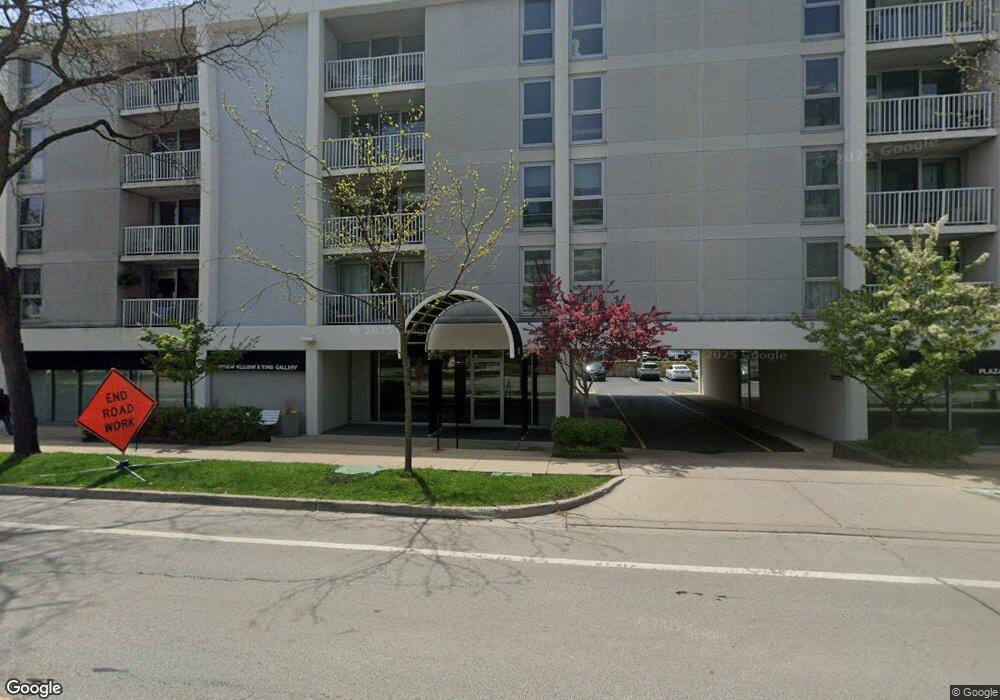
Sheridan House 1625 Sheridan Rd Unit 400 Wilmette, IL 60091
Estimated Value: $330,374 - $477,000
2
Beds
--
Bath
1,084
Sq Ft
$350/Sq Ft
Est. Value
About This Home
This home is located at 1625 Sheridan Rd Unit 400, Wilmette, IL 60091 and is currently estimated at $379,094, approximately $349 per square foot. 1625 Sheridan Rd Unit 400 is a home located in Cook County with nearby schools including Central Elementary School, Highcrest Middle School, and Wilmette Junior High School.
Ownership History
Date
Name
Owned For
Owner Type
Purchase Details
Closed on
Jan 24, 2020
Sold by
Mcdonagh Jeanne M and The Jeanne M Mcdonagh Trust
Bought by
Green Scott B
Current Estimated Value
Home Financials for this Owner
Home Financials are based on the most recent Mortgage that was taken out on this home.
Original Mortgage
$198,750
Interest Rate
0.14%
Mortgage Type
Future Advance Clause Open End Mortgage
Purchase Details
Closed on
May 17, 2004
Sold by
Mcdonagh Jeanne M
Bought by
Mcdonagh Jeanne M and Jeanne M Mcdonagh Trust
Purchase Details
Closed on
Dec 10, 1998
Sold by
Mcdonagh Jeanne M
Bought by
Mcdonagh Harry E and Mcdonagh Jeanne M
Purchase Details
Closed on
Aug 24, 1996
Sold by
Mcdonagh Maureen T
Bought by
Mcdonagh Jeanne M
Purchase Details
Closed on
Aug 1, 1996
Sold by
Mcdonagh Harry F and Mcdonagh Jeanne M
Bought by
Mcdonagh Maureen T
Create a Home Valuation Report for This Property
The Home Valuation Report is an in-depth analysis detailing your home's value as well as a comparison with similar homes in the area
Home Values in the Area
Average Home Value in this Area
Purchase History
| Date | Buyer | Sale Price | Title Company |
|---|---|---|---|
| Green Scott B | $160,000 | First American Title | |
| Mcdonagh Jeanne M | -- | -- | |
| Mcdonagh Harry E | -- | -- | |
| Mcdonagh Jeanne M | -- | -- | |
| Mcdonagh Maureen T | -- | -- |
Source: Public Records
Mortgage History
| Date | Status | Borrower | Loan Amount |
|---|---|---|---|
| Previous Owner | Green Scott B | $198,750 |
Source: Public Records
Tax History Compared to Growth
Tax History
| Year | Tax Paid | Tax Assessment Tax Assessment Total Assessment is a certain percentage of the fair market value that is determined by local assessors to be the total taxable value of land and additions on the property. | Land | Improvement |
|---|---|---|---|---|
| 2024 | $5,300 | $23,357 | $2,350 | $21,007 |
| 2023 | $5,016 | $23,357 | $2,350 | $21,007 |
| 2022 | $5,016 | $23,357 | $2,350 | $21,007 |
| 2021 | $4,408 | $16,967 | $2,050 | $14,917 |
| 2020 | $4,336 | $16,967 | $2,050 | $14,917 |
| 2019 | $4,645 | $20,361 | $2,050 | $18,311 |
| 2018 | $3,861 | $16,227 | $1,708 | $14,519 |
| 2017 | $1,549 | $16,227 | $1,708 | $14,519 |
| 2016 | $2,003 | $16,227 | $1,708 | $14,519 |
| 2015 | $2,403 | $15,551 | $1,409 | $14,142 |
| 2014 | $2,316 | $15,551 | $1,409 | $14,142 |
| 2013 | $2,138 | $15,551 | $1,409 | $14,142 |
Source: Public Records
About Sheridan House
Map
Nearby Homes
- 1630 Sheridan Rd Unit 5K
- 1630 Sheridan Rd Unit 2F
- 1630 Sheridan Rd Unit 2N
- 1630 Sheridan Rd Unit 2J
- 1616 Sheridan Rd Unit 9H
- 901 Westerfield Dr
- 141 Kenilworth Ave
- 512 Elmwood Ave
- 501 Sheridan Rd
- 528 Roslyn Rd
- 527 Warwick Rd
- 724 12th St Unit 105
- 517 Cumnor Rd
- 900 Sheridan Rd
- 621 Green Bay Rd
- 1025 Central Ave
- 315 Washington Ave
- 526 Linden Ave
- 1142 Oakwood Ave
- 410 Prairie Ave
- 1625 Sheridan Rd Unit 505
- 1625 Sheridan Rd Unit 511
- 1625 Sheridan Rd Unit 309
- 1625 Sheridan Rd Unit 507
- 1625 Sheridan Rd Unit 506
- 1625 Sheridan Rd Unit 409
- 1625 Sheridan Rd Unit 407
- 1625 Sheridan Rd Unit 404
- 1625 Sheridan Rd Unit 403
- 1625 Sheridan Rd Unit 402
- 1625 Sheridan Rd Unit 312
- 1625 Sheridan Rd Unit 308
- 1625 Sheridan Rd Unit 307
- 1625 Sheridan Rd Unit 213
- 1625 Sheridan Rd Unit 200
- 1625 Sheridan Rd Unit 303
- 1625 Sheridan Rd Unit 301
- 1625 Sheridan Rd Unit 204
- 1625 Sheridan Rd Unit 501
- 1625 Sheridan Rd Unit 209