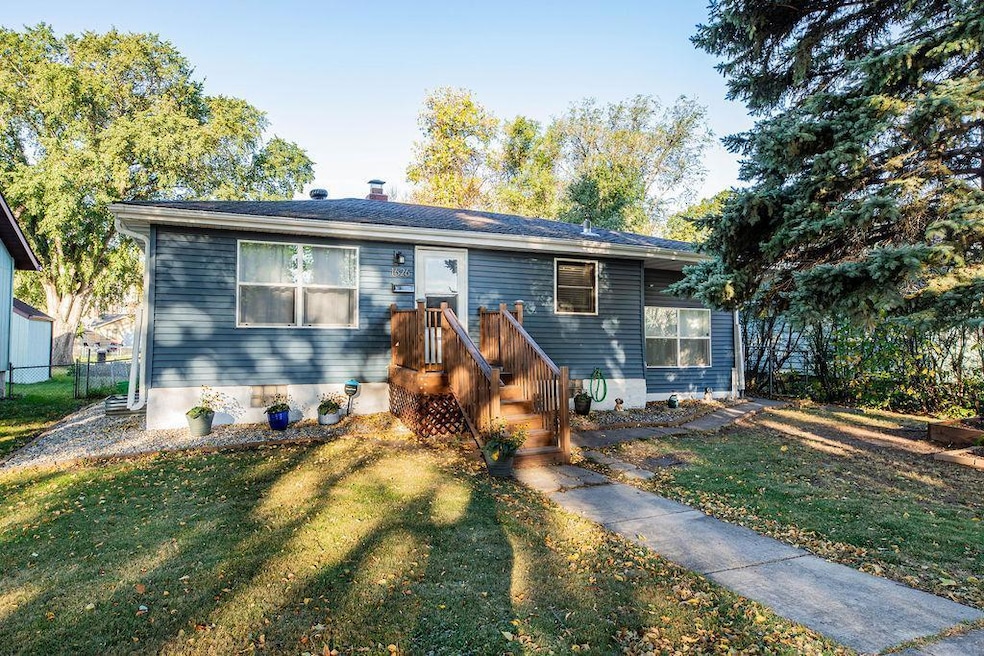
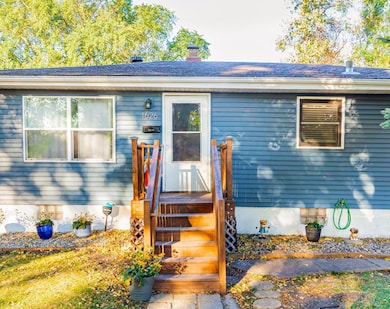
1626 11th St N Fargo, ND 58102
Washington NeighborhoodEstimated payment $1,651/month
Highlights
- No HOA
- Porch
- Laundry Room
- North High School Rated A-
- Living Room
- 5-minute walk to Dacotah Field
About This Home
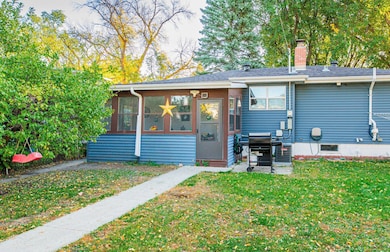
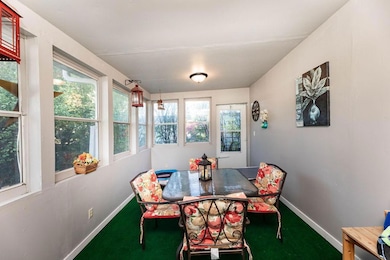
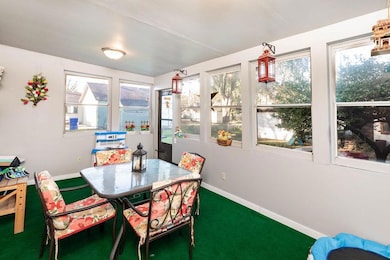
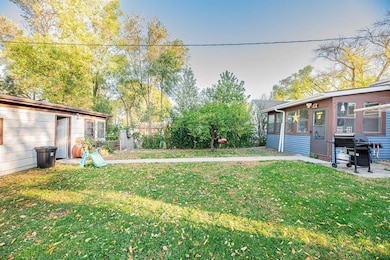
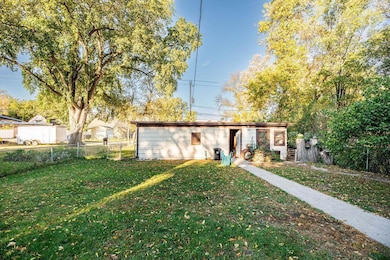
$15,000 Price Drop! This home was so affordable before and now it's even BETTER! Move-In Ready + Full of Character! This updated 3-bedroom rambler has all the charm you want and the updates you need. Enjoy refinished hardwood floors, fresh carpet, and a custom kitchen with solid oak cabinetry and quality laminate countertops. The bathroom’s been nicely redone with modern fixtures, lighting, and trim — just move in and relax. The finished basement gives you extra hangout space with a family room, egress window, half bath, and all the behind-the-scenes upgrades already done — drain tile, bracing, updated plumbing, electrical, and furnace. Unwind in the cozy 3-season porch overlooking your large, fenced backyard — perfect for pets, games, or backyard BBQs. Plus, you’ll have plenty of room for hobbies or storage in the oversized 25x25 garage with an attached 10x10 shop and handy alley access. And here’s a bonus you’ll love: the sellers already did a professional home inspection — and they’re giving it to you for free!
Listing Agent
Berkshire Hathaway HomeServices Premier Properties Listed on: 10/07/2025

Home Details
Home Type
- Single Family
Est. Annual Taxes
- $2,761
Year Built
- Built in 1948
Lot Details
- 7,013 Sq Ft Lot
- Lot Dimensions are 50 x 140
Parking
- 2 Car Garage
- Garage Door Opener
Home Design
- Architectural Shingle Roof
- Vinyl Siding
Interior Spaces
- 1-Story Property
- Family Room
- Living Room
- Utility Room
- Basement
- Block Basement Construction
Kitchen
- Range
- Microwave
- Dishwasher
- Disposal
Bedrooms and Bathrooms
- 3 Bedrooms
Laundry
- Laundry Room
- Dryer
- Washer
Outdoor Features
- Porch
Utilities
- Forced Air Heating and Cooling System
- Electric Water Heater
Community Details
- No Home Owners Association
- Chandlers Broadway Subdivision
Listing and Financial Details
- Assessor Parcel Number 01038001940000
Map
Home Values in the Area
Average Home Value in this Area
Tax History
| Year | Tax Paid | Tax Assessment Tax Assessment Total Assessment is a certain percentage of the fair market value that is determined by local assessors to be the total taxable value of land and additions on the property. | Land | Improvement |
|---|---|---|---|---|
| 2024 | $2,761 | $111,550 | $20,050 | $91,500 |
| 2023 | $3,051 | $104,250 | $20,050 | $84,200 |
| 2022 | $3,041 | $102,200 | $20,050 | $82,150 |
| 2021 | $2,836 | $96,400 | $20,050 | $76,350 |
| 2020 | $2,681 | $91,800 | $20,050 | $71,750 |
| 2019 | $2,665 | $91,800 | $11,900 | $79,900 |
| 2018 | $2,452 | $81,650 | $11,900 | $69,750 |
| 2017 | $2,291 | $76,300 | $11,900 | $64,400 |
| 2016 | $1,965 | $69,350 | $11,900 | $57,450 |
| 2015 | $2,074 | $69,350 | $8,150 | $61,200 |
| 2014 | $2,154 | $70,750 | $8,150 | $62,600 |
| 2013 | $2,152 | $67,400 | $8,150 | $59,250 |
Property History
| Date | Event | Price | List to Sale | Price per Sq Ft |
|---|---|---|---|---|
| 10/27/2025 10/27/25 | Price Changed | $270,000 | -5.3% | $153 / Sq Ft |
| 10/07/2025 10/07/25 | For Sale | $285,000 | -- | $162 / Sq Ft |
Purchase History
| Date | Type | Sale Price | Title Company |
|---|---|---|---|
| Warranty Deed | $190,000 | Plains Title Llc | |
| Warranty Deed | $25,000 | Regency Title Inc | |
| Personal Reps Deed | -- | -- |
Mortgage History
| Date | Status | Loan Amount | Loan Type |
|---|---|---|---|
| Open | $186,558 | FHA |
Source: NorthstarMLS
MLS Number: 6800383
APN: 01-0380-01940-000
Disclaimer: Certain information contained herein is derived from information provided by parties other than Homes.com. All information provided is deemed reliable, but is not guaranteed to be accurate and should be independently verified.
![]() Based on information submitted to the MLS GRID. All data is obtained from various sources and may not have been verified by broker or MLS GRID. Supplied Open House Information is subject to change without notice. All information should be independently reviewed and verified for accuracy. Properties may or may not be listed by the office/agent presenting the information. Some IDX listings have been excluded from this website.
Based on information submitted to the MLS GRID. All data is obtained from various sources and may not have been verified by broker or MLS GRID. Supplied Open House Information is subject to change without notice. All information should be independently reviewed and verified for accuracy. Properties may or may not be listed by the office/agent presenting the information. Some IDX listings have been excluded from this website.
The Digital Millennium Copyright Act of 1998, 17 U.S.C. § 512 (the “DMCA”) provides recourse for copyright owners who believe that material appearing on the Internet infringes their rights under U.S. copyright law. If you believe in good faith that any content or material made available in connection with our website or services infringes your copyright, you (or your agent) may send us a notice requesting that the content or material be removed, or access to it blocked.
Notices must be sent in writing by email to DMCAnotice@MLSGrid.com.
The DMCA requires that your notice of alleged copyright infringement include the following information:
(1) description of the copyrighted work that is the subject of claimed infringement;
(2) description of the alleged infringing content and information sufficient to permit us to locate the content;
(3) contact information for you, including your address, telephone number and email address;
(4) a statement by you that you have a good faith belief that the content in the manner complained of is not authorized by the copyright owner, or its agent, or by the operation of any law;
(5) a statement by you, signed under penalty of perjury, that the information in the notification is accurate and that you have the authority to enforce the copyrights that are claimed to be infringed; and
(6) a physical or electronic signature of the copyright owner or a person authorized to act on the copyright owner’s behalf. Failure to include all of the above information may result in the delay of the processing of your complaint.
- 1601 University Dr N
- 1919 University Dr N
- 1342 Broadway N
- 1302 9th St N
- 1310 Broadway N
- 1146 9th St N
- 1113 University Dr N
- 1224 11th Ave N
- 1224 11th Ave N
- 814 11th Ave N
- 714 11th Ave N
- 1132 16th St N
- 1120 16th St N
- 1515 11th Ave N
- 1221 10th Ave N Unit 2
- 517 28th Ave N
- 906 12th St N
- 1021-1034 15th N
- 1109 18th St S
- 1118 9th Ave N Unit Down