1626 1st Ave S Fargo, ND 58103
Jefferson-Carl NeighborhoodEstimated Value: $185,000 - $274,368
3
Beds
2
Baths
864
Sq Ft
$275/Sq Ft
Est. Value
About This Home
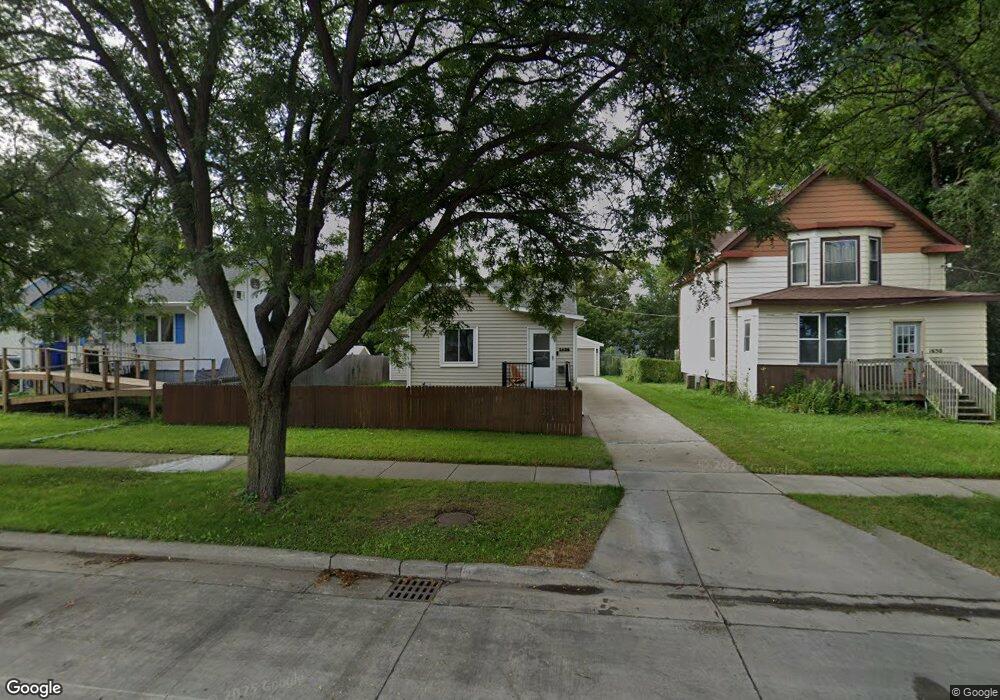
This home is located at 1626 1st Ave S, Fargo, ND 58103 and is currently estimated at $237,842, approximately $275 per square foot. 1626 1st Ave S is a home located in Cass County with nearby schools including Jefferson Elementary School, Ben Franklin Middle School, and South High School.
Ownership History
Date
Name
Owned For
Owner Type
Purchase Details
Closed on
Aug 14, 2025
Sold by
Soma Sierra
Bought by
Vargas Ilich F Torres
Current Estimated Value
Purchase Details
Closed on
Jun 21, 2022
Sold by
Vander Hagen Jeremie and Vander Anita
Bought by
Torres Ilich F and Soma Vargas Sierra
Home Financials for this Owner
Home Financials are based on the most recent Mortgage that was taken out on this home.
Original Mortgage
$237,650
Interest Rate
5.27%
Mortgage Type
New Conventional
Purchase Details
Closed on
Mar 17, 2020
Sold by
Dc Ehab Llc
Bought by
Vander Hagen Jeremie and Vander Van Der
Purchase Details
Closed on
Nov 25, 2019
Sold by
Valley Property Partners Llc
Bought by
Dc Rehab Llc
Purchase Details
Closed on
Nov 20, 2009
Sold by
Schindler Maurice C
Bought by
Schindler Maurice C and Hanson Julie C
Create a Home Valuation Report for This Property
The Home Valuation Report is an in-depth analysis detailing your home's value as well as a comparison with similar homes in the area
Home Values in the Area
Average Home Value in this Area
Purchase History
| Date | Buyer | Sale Price | Title Company |
|---|---|---|---|
| Vargas Ilich F Torres | -- | None Listed On Document | |
| Torres Ilich F | $245,000 | Fm Title | |
| Vander Hagen Jeremie | $103,500 | Fm Title | |
| Dc Rehab Llc | $59,000 | Regency Title Inc | |
| Valley Property Partners Llc | $41,012 | Regency Title Inc | |
| Schindler Maurice C | -- | -- |
Source: Public Records
Mortgage History
| Date | Status | Borrower | Loan Amount |
|---|---|---|---|
| Previous Owner | Torres Ilich F | $237,650 |
Source: Public Records
Tax History Compared to Growth
Tax History
| Year | Tax Paid | Tax Assessment Tax Assessment Total Assessment is a certain percentage of the fair market value that is determined by local assessors to be the total taxable value of land and additions on the property. | Land | Improvement |
|---|---|---|---|---|
| 2024 | $2,480 | $99,850 | $12,700 | $87,150 |
| 2023 | $2,862 | $96,000 | $12,700 | $83,300 |
| 2022 | $2,283 | $73,150 | $12,700 | $60,450 |
| 2021 | $2,111 | $68,050 | $12,700 | $55,350 |
| 2020 | $2,107 | $68,050 | $12,700 | $55,350 |
| 2019 | $1,666 | $52,050 | $6,350 | $45,700 |
| 2018 | $1,648 | $52,050 | $6,350 | $45,700 |
| 2017 | $1,633 | $52,050 | $6,350 | $45,700 |
| 2016 | $870 | $50,550 | $6,350 | $44,200 |
| 2015 | $814 | $42,900 | $4,450 | $38,450 |
| 2014 | $1,280 | $39,000 | $4,450 | $34,550 |
| 2013 | $70 | $37,150 | $4,450 | $32,700 |
Source: Public Records
Map
Nearby Homes