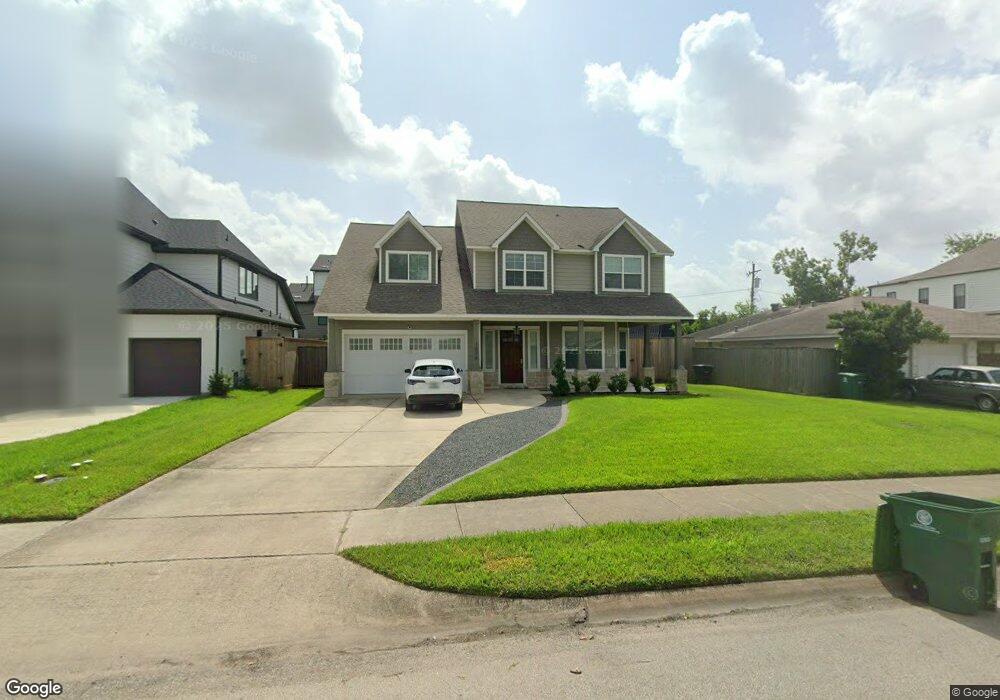
1626 Bayram Dr Houston, TX 77055
Spring Branch East NeighborhoodEstimated Value: $1,218,000 - $1,544,000
4
Beds
4
Baths
3,892
Sq Ft
$358/Sq Ft
Est. Value
About This Home
This home is located at 1626 Bayram Dr, Houston, TX 77055 and is currently estimated at $1,393,749, approximately $358 per square foot. 1626 Bayram Dr is a home located in Harris County with nearby schools including Valley Oaks Elementary School, Landrum Middle School, and Memorial High School.
Ownership History
Date
Name
Owned For
Owner Type
Purchase Details
Closed on
Dec 28, 2015
Sold by
Opila Raymond and Opila Maria
Bought by
Shaw Andre Hui and Quah Yu X
Current Estimated Value
Home Financials for this Owner
Home Financials are based on the most recent Mortgage that was taken out on this home.
Original Mortgage
$634,400
Outstanding Balance
$504,882
Interest Rate
3.98%
Estimated Equity
$888,867
Purchase Details
Closed on
Feb 7, 2014
Sold by
Poole Wendy
Bought by
Opila Ray Mond and Opila Maria
Home Financials for this Owner
Home Financials are based on the most recent Mortgage that was taken out on this home.
Original Mortgage
$152,000
Interest Rate
4.56%
Purchase Details
Closed on
Mar 23, 2001
Sold by
Drew Lorraine Klim and Drew Johnny E
Bought by
Poole Wendy
Home Financials for this Owner
Home Financials are based on the most recent Mortgage that was taken out on this home.
Original Mortgage
$106,160
Interest Rate
6.98%
Mortgage Type
FHA
Create a Home Valuation Report for This Property
The Home Valuation Report is an in-depth analysis detailing your home's value as well as a comparison with similar homes in the area
Home Values in the Area
Average Home Value in this Area
Purchase History
| Date | Buyer | Sale Price | Title Company |
|---|---|---|---|
| Shaw Andre Hui | -- | None Available | |
| Opila Ray Mond | -- | None Available | |
| Poole Wendy | -- | -- |
Source: Public Records
Mortgage History
| Date | Status | Borrower | Loan Amount |
|---|---|---|---|
| Open | Shaw Andre Hui | $634,400 | |
| Previous Owner | Opila Ray Mond | $152,000 | |
| Previous Owner | Poole Wendy | $106,160 |
Source: Public Records
Tax History Compared to Growth
Tax History
| Year | Tax Paid | Tax Assessment Tax Assessment Total Assessment is a certain percentage of the fair market value that is determined by local assessors to be the total taxable value of land and additions on the property. | Land | Improvement |
|---|---|---|---|---|
| 2025 | $20,826 | $1,258,500 | $425,125 | $833,375 |
| 2024 | $20,826 | $1,330,078 | $425,125 | $904,953 |
| 2023 | $20,826 | $1,248,600 | $408,120 | $840,480 |
| 2022 | $25,024 | $1,045,755 | $357,105 | $688,650 |
| 2021 | $22,783 | $933,150 | $357,105 | $576,045 |
| 2020 | $22,936 | $1,020,747 | $322,200 | $698,547 |
| 2019 | $22,967 | $845,000 | $322,200 | $522,800 |
| 2018 | $7,762 | $793,000 | $322,200 | $470,800 |
| 2017 | $20,746 | $793,000 | $322,200 | $470,800 |
| 2016 | $20,746 | $793,000 | $322,200 | $470,800 |
| 2015 | $4,743 | $481,728 | $304,300 | $177,428 |
| 2014 | $4,743 | $232,561 | $143,200 | $89,361 |
Source: Public Records
Map
Nearby Homes
- 1701 Bayram Dr
- 1607 W Rose Terrace Ln
- 1719 Bayram Dr
- 1614 Ojeman Rd Unit E
- 1614 Ojeman Rd Unit J
- 1526 Ojeman Rd Unit A
- 8603 Costmary Ln
- 1653 Bingle Rd
- 8706 Strongoak Ln
- 1441 Bingle Rd
- 1720 Sedola Ln
- 1704 Sedola Ln
- 1506 Longacre Dr
- 1510 Longacre Dr
- 1705 Bologna Ln
- 1711 Bologna Ln
- 1707 Bologna Ln
- 1709 Bologna Ln
- 1518 Hillendahl Blvd
- 1715 Bologna Ln
- 1630 Bayram Dr
- 1622 Bayram Dr
- 1639 Moritz Dr
- 1634 Bayram Dr
- 1625 Bayram Dr
- 1621 Bayram Dr
- 1629 Bayram Dr
- 1614 Bayram Dr
- 1617 Bayram Dr
- 1633 Bayram Dr
- 1613 Bayram Dr
- 1610 Bayram Dr
- 1715 Moritz Unit 31
- 1702 Bayram Dr
- 1609 Bayram Dr
- 1626 Ronson Rd
- 1622 Ronson Rd
- 1630 Ronson Rd
- 1618 Ronson Rd
- 1606 Bayram Dr