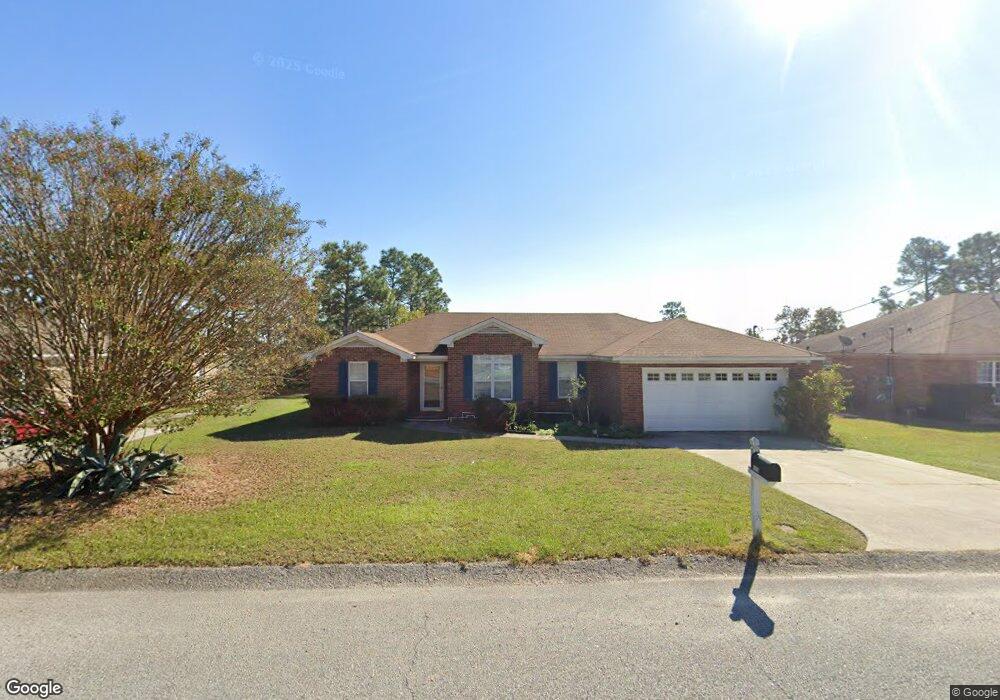
1626 Creek Run Rd Hephzibah, GA 30815
Jamestown NeighborhoodEstimated Value: $229,000 - $238,000
3
Beds
2
Baths
1,587
Sq Ft
$147/Sq Ft
Est. Value
About This Home
This home is located at 1626 Creek Run Rd, Hephzibah, GA 30815 and is currently estimated at $233,094, approximately $146 per square foot. 1626 Creek Run Rd is a home located in Richmond County with nearby schools including Deer Chase Elementary School, Hephzibah Middle School, and Johnson Magnet.
Ownership History
Date
Name
Owned For
Owner Type
Purchase Details
Closed on
Mar 28, 2000
Sold by
Bank Of America Na
Bought by
Jack R Nordahl Builders Inc
Current Estimated Value
Home Financials for this Owner
Home Financials are based on the most recent Mortgage that was taken out on this home.
Original Mortgage
$87,210
Outstanding Balance
$29,663
Interest Rate
8.34%
Estimated Equity
$203,431
Purchase Details
Closed on
Mar 24, 2000
Sold by
Jack R Nordahl Builders Inc
Bought by
Tran Loc and Nguyen Dung Ngoc T
Home Financials for this Owner
Home Financials are based on the most recent Mortgage that was taken out on this home.
Original Mortgage
$87,210
Outstanding Balance
$29,663
Interest Rate
8.34%
Estimated Equity
$203,431
Purchase Details
Closed on
Jan 21, 2000
Sold by
Central & Southern Bank Of Georgia
Bought by
Southern Specialty Development Co Inc
Purchase Details
Closed on
Jan 6, 2000
Sold by
Southern Specialty Development Co Inc
Bought by
Jack R Nordahl Builders Inc
Create a Home Valuation Report for This Property
The Home Valuation Report is an in-depth analysis detailing your home's value as well as a comparison with similar homes in the area
Home Values in the Area
Average Home Value in this Area
Purchase History
| Date | Buyer | Sale Price | Title Company |
|---|---|---|---|
| Jack R Nordahl Builders Inc | -- | -- | |
| Tran Loc | $96,900 | -- | |
| Southern Specialty Development Co Inc | -- | -- | |
| Jack R Nordahl Builders Inc | $14,000 | -- |
Source: Public Records
Mortgage History
| Date | Status | Borrower | Loan Amount |
|---|---|---|---|
| Open | Tran Loc | $87,210 |
Source: Public Records
Tax History Compared to Growth
Tax History
| Year | Tax Paid | Tax Assessment Tax Assessment Total Assessment is a certain percentage of the fair market value that is determined by local assessors to be the total taxable value of land and additions on the property. | Land | Improvement |
|---|---|---|---|---|
| 2025 | $1,188 | $93,280 | $12,400 | $80,880 |
| 2024 | $1,188 | $87,376 | $12,400 | $74,976 |
| 2023 | $1,096 | $79,096 | $12,400 | $66,696 |
| 2022 | $990 | $62,446 | $12,400 | $50,046 |
| 2021 | $945 | $52,317 | $12,400 | $39,917 |
| 2020 | $951 | $52,317 | $12,400 | $39,917 |
| 2019 | $990 | $52,317 | $12,400 | $39,917 |
| 2018 | $991 | $52,000 | $12,400 | $39,600 |
| 2017 | $1,882 | $52,000 | $12,400 | $39,600 |
| 2016 | $1,884 | $52,000 | $12,400 | $39,600 |
| 2015 | $1,896 | $52,000 | $12,400 | $39,600 |
| 2014 | $1,896 | $51,930 | $12,400 | $39,530 |
Source: Public Records
Map
Nearby Homes
- 2213 Riley Ct
- 2682 Inverness Dr
- 2686 Inverness Dr
- 2690 Inverness Dr
- 1914 Mitchell Place
- 1855 Beaver Creek Ln
- 2525 Hollington Dr
- 2705 Inverness Dr
- 2613 Inverness Dr
- 2709 Inverness Dr
- 2524 Hollington Dr
- 2698 Inverness Dr
- 2713 Inverness Dr
- 2520 Hollington Dr
- 2706 Inverness Dr
- 2710 Inverness Dr
- 2721 Inverness Dr
- 2512 Hollington Dr
- 2725 Inverness Dr
- 2505 Hollington Dr
- 1628 Creek Run Rd
- 1624 Creek Run Rd
- 1630 Creek Run Rd
- 1622 Creek Run Rd
- 2631 Spirit Creek Rd
- 2635 Spirit Creek Rd
- 1625 Creek Run Rd
- 1623 Creek Run Rd
- 1627 Creek Run Rd
- 2637 Spirit Creek Rd
- 2629 Spirit Creek Rd
- 1632 Creek Run Rd
- 1620 Creek Run Rd
- 1621 Creek Run Rd
- 1629 Creek Run Rd
- 2639 Spirit Creek Rd
- 2627 Spirit Creek Rd
- 1619 Creek Run Rd
- 1618 Creek Run Rd