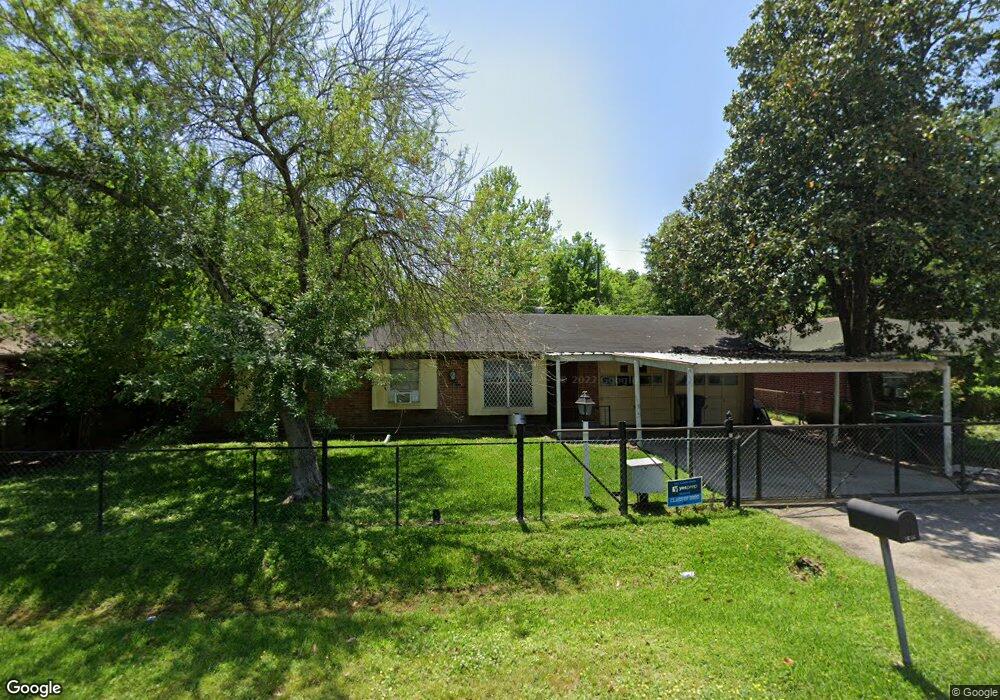
1626 Debeney Dr Houston, TX 77039
Estimated Value: $175,888 - $275,000
3
Beds
1
Bath
984
Sq Ft
$227/Sq Ft
Est. Value
About This Home
This home is located at 1626 Debeney Dr, Houston, TX 77039 and is currently estimated at $223,722, approximately $227 per square foot. 1626 Debeney Dr is a home located in Harris County with nearby schools including Vardeman EC/PK/K, Reed Academy, and Grantham Academy.
Ownership History
Date
Name
Owned For
Owner Type
Purchase Details
Closed on
Aug 19, 2022
Sold by
Vicky Casanova
Bought by
Gonzalez Marvin Elias Bravo
Current Estimated Value
Purchase Details
Closed on
Jul 15, 2022
Sold by
Carlos Casanova
Bought by
Casanova Vicky
Purchase Details
Closed on
Apr 26, 2011
Sold by
Casanova Hilda R and Casanova Hilda Anisia
Bought by
Casanova Carlos and Casanova Hilda R
Create a Home Valuation Report for This Property
The Home Valuation Report is an in-depth analysis detailing your home's value as well as a comparison with similar homes in the area
Home Values in the Area
Average Home Value in this Area
Purchase History
| Date | Buyer | Sale Price | Title Company |
|---|---|---|---|
| Gonzalez Marvin Elias Bravo | -- | None Listed On Document | |
| Casanova Vicky | -- | None Listed On Document | |
| Casanova Carlos | -- | None Available |
Source: Public Records
Tax History Compared to Growth
Tax History
| Year | Tax Paid | Tax Assessment Tax Assessment Total Assessment is a certain percentage of the fair market value that is determined by local assessors to be the total taxable value of land and additions on the property. | Land | Improvement |
|---|---|---|---|---|
| 2025 | $3,368 | $177,953 | $38,024 | $139,929 |
| 2024 | $3,368 | $174,084 | $38,024 | $136,060 |
| 2023 | $3,684 | $197,878 | $38,024 | $159,854 |
| 2022 | $1,810 | $88,038 | $16,449 | $71,589 |
| 2021 | $1,766 | $88,038 | $16,449 | $71,589 |
| 2020 | $1,692 | $88,038 | $16,449 | $71,589 |
| 2019 | $1,611 | $67,725 | $16,102 | $51,623 |
| 2018 | $108 | $72,230 | $17,315 | $54,915 |
| 2017 | $1,637 | $72,230 | $17,315 | $54,915 |
| 2016 | $1,885 | $83,164 | $17,315 | $65,849 |
| 2015 | $406 | $83,164 | $17,315 | $65,849 |
| 2014 | $406 | $83,164 | $17,315 | $65,849 |
Source: Public Records
Map
Nearby Homes
- 13310 Robertcrest St Unit B
- 1810 Connorvale Rd
- 13113 Reeveston Rd
- 13635 Reeveston Rd
- 13530 Luthe Rd
- 1720 Strawn Rd
- 12123 Steeple Ln
- 1730 Strawn Rd
- 28351 W Hardy Rd
- 1722 Strawn Rd
- 1725 Strawn Rd
- 12969 W Hardy Rd
- 13917 Chrisman Rd
- 13920 Reeveston Rd
- 2434 Balmorhea Ave
- 1916 Gault Rd
- 2438 Balmorhea Ave
- 13610 Carmilenda St
- 2611 Lauder Rd
- 14215 Sweeney Rd
- 1630 Debeney Dr
- 1622 Debeney Dr
- 1621 Aldine Mail Route Rd
- 1618 Debeney Dr
- 1634 Debeney Dr
- 1623 Debeney Dr
- 1627 Debeney Dr
- 1619 Debeney Dr
- 1614 Debeney Dr
- 1631 Debeney Dr
- 1615 Debeney Dr
- 1622 Charriton Dr
- 1626 Charriton Dr
- 1610 Debeney Dr
- 1618 Charriton Dr
- 1702 Debeney Dr
- 1611 Debeney Dr
- 1630 Charriton Dr
- 1614 Charriton Dr
- 1703 Debeney Dr