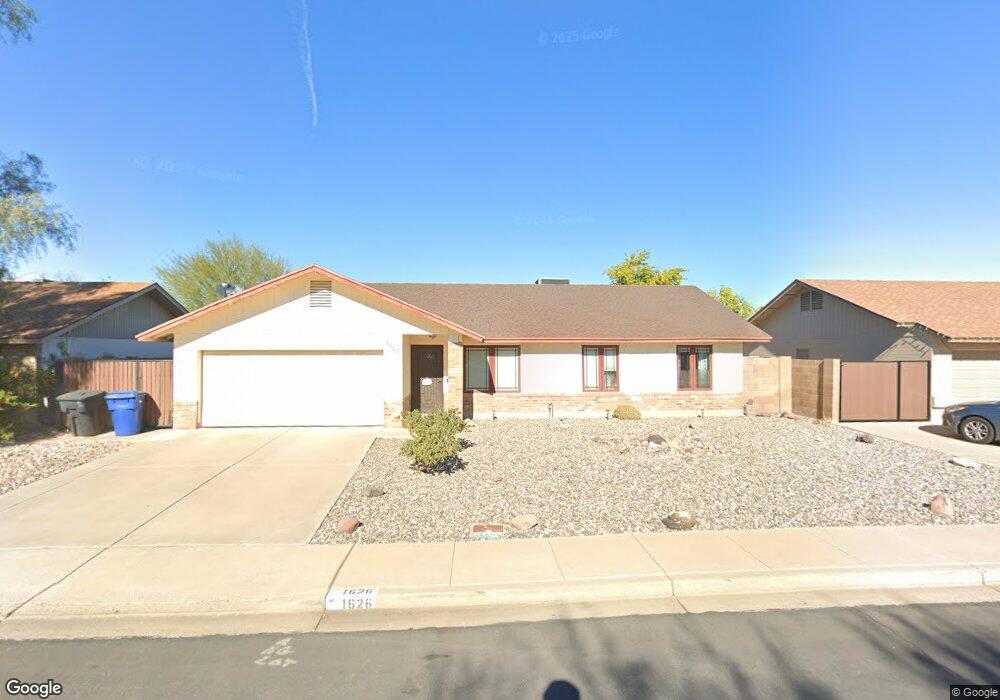
1626 E Inverness Ave Mesa, AZ 85204
Woodbridge Crossing NeighborhoodEstimated Value: $319,000 - $457,000
Studio
2
Baths
1,460
Sq Ft
$269/Sq Ft
Est. Value
About This Home
This home is located at 1626 E Inverness Ave, Mesa, AZ 85204 and is currently estimated at $392,872, approximately $269 per square foot. 1626 E Inverness Ave is a home located in Maricopa County with nearby schools including Harris Elementary School, Mesquite Junior High School, and Mesquite High School.
Ownership History
Date
Name
Owned For
Owner Type
Purchase Details
Closed on
Jun 25, 2009
Sold by
Rohr Douglas G and Rohr Veda B
Bought by
Rohr Doug and Rohr Veda
Current Estimated Value
Purchase Details
Closed on
Jun 28, 1999
Sold by
Lemons Roger R and Lemons Linda J
Bought by
Rohr Douglas G and Rohr Veda B
Home Financials for this Owner
Home Financials are based on the most recent Mortgage that was taken out on this home.
Original Mortgage
$111,778
Outstanding Balance
$31,186
Interest Rate
7.51%
Mortgage Type
FHA
Estimated Equity
$361,686
Purchase Details
Closed on
Jul 10, 1996
Sold by
Blattman Kathryn
Bought by
Lemons Roger R and Lemons Linda J
Home Financials for this Owner
Home Financials are based on the most recent Mortgage that was taken out on this home.
Original Mortgage
$89,519
Interest Rate
8.39%
Mortgage Type
FHA
Create a Home Valuation Report for This Property
The Home Valuation Report is an in-depth analysis detailing your home's value as well as a comparison with similar homes in the area
Home Values in the Area
Average Home Value in this Area
Purchase History
| Date | Buyer | Sale Price | Title Company |
|---|---|---|---|
| Rohr Doug | -- | None Available | |
| Rohr Douglas G | $112,700 | First American Title | |
| Lemons Roger R | $90,000 | First American Title |
Source: Public Records
Mortgage History
| Date | Status | Borrower | Loan Amount |
|---|---|---|---|
| Open | Rohr Douglas G | $111,778 | |
| Previous Owner | Lemons Roger R | $89,519 |
Source: Public Records
Tax History
| Year | Tax Paid | Tax Assessment Tax Assessment Total Assessment is a certain percentage of the fair market value that is determined by local assessors to be the total taxable value of land and additions on the property. | Land | Improvement |
|---|---|---|---|---|
| 2025 | $1,202 | $16,248 | -- | -- |
| 2024 | $1,166 | $15,475 | -- | -- |
| 2023 | $1,166 | $30,250 | $6,050 | $24,200 |
| 2022 | $1,138 | $23,430 | $4,680 | $18,750 |
| 2021 | $1,232 | $22,800 | $4,560 | $18,240 |
| 2020 | $1,211 | $20,430 | $4,080 | $16,350 |
| 2019 | $1,122 | $18,400 | $3,680 | $14,720 |
| 2018 | $1,068 | $16,760 | $3,350 | $13,410 |
| 2017 | $1,034 | $15,260 | $3,050 | $12,210 |
| 2016 | $1,073 | $15,110 | $3,020 | $12,090 |
| 2015 | $984 | $12,520 | $2,500 | $10,020 |
Source: Public Records
Map
Nearby Homes
- 1753 E Jacinto Cir
- 1756 E Harmony Ave
- 1414 N Birch St
- 1927 E Hampton Ave Unit 207
- 1927 E Hampton Ave Unit 263
- 1927 E Hampton Ave Unit 212
- 1448 S Doran
- 1602 E Grove Ave
- 1417 N Dana St
- 1500 N Sunview Pkwy Unit 20
- 1500 N Sunview Pkwy Unit 19
- 1285 N Evergreen St
- 1713 E Gable Ave
- 1431 E Garnet Ave
- 1626 E Garnet Ave
- 1308 South Spur
- 1255 N Evergreen St
- 2220 E Jerome Ave
- 1342 N Mckenna Ln
- 0 E Baseline Rd Unit 6933479
- 1634 E Inverness Ave
- 1618 E Inverness Ave
- 1627 E Impala Ave
- 1619 E Impala Ave
- 1635 E Impala Ave
- 1642 E Inverness Ave
- 1625 E Inverness Ave
- 1633 E Inverness Ave
- 1617 E Inverness Ave
- 1744 South Hill
- 1641 E Inverness Ave
- 1752 S Hill
- 1648 E Inverness Ave
- 1744 S Hill
- 1609 E Inverness Ave
- 1649 E Impala Ave
- 1736 S Hill
- 1736 South Hill
- 1647 E Inverness Ave
- 1624 E Impala Ave
Your Personal Tour Guide
Ask me questions while you tour the home.