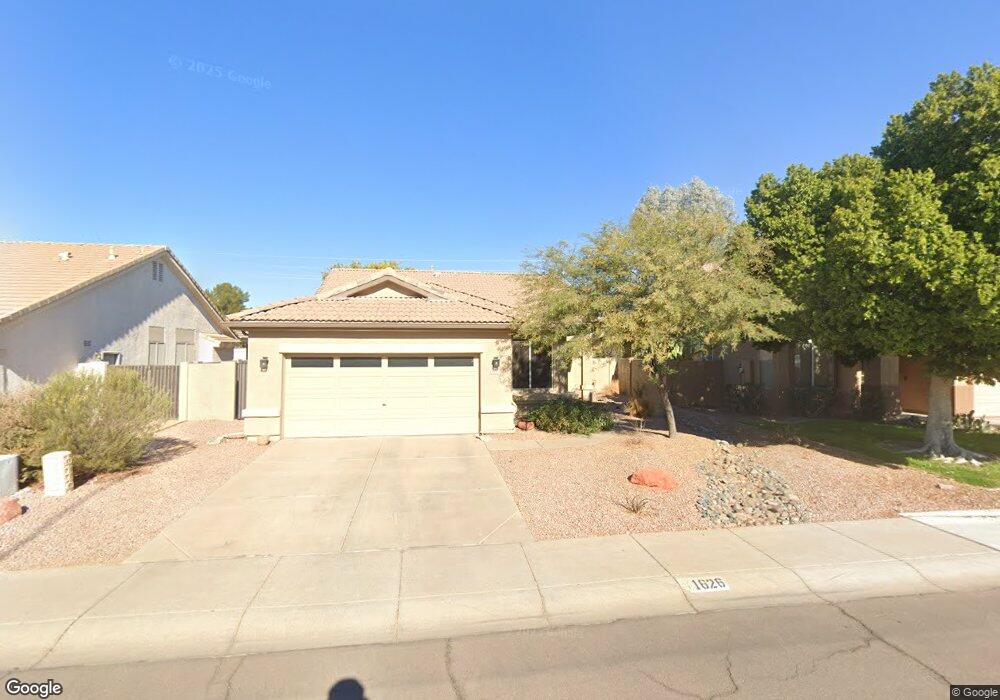
1626 E Megan St Chandler, AZ 85225
East Chandler NeighborhoodEstimated Value: $383,000 - $529,000
Studio
3
Baths
1,612
Sq Ft
$288/Sq Ft
Est. Value
About This Home
This home is located at 1626 E Megan St, Chandler, AZ 85225 and is currently estimated at $464,950, approximately $288 per square foot. 1626 E Megan St is a home located in Maricopa County with nearby schools including Sanborn Elementary School, Willis Junior High School, and Chandler High School.
Ownership History
Date
Name
Owned For
Owner Type
Purchase Details
Closed on
Jan 28, 2026
Sold by
Pina Phillip Michael
Bought by
Phillip Pina Trust and Pina
Current Estimated Value
Purchase Details
Closed on
Jul 15, 2021
Sold by
Mier Ruben and Mier Melissa Ann
Bought by
Pina Phillip Michael
Home Financials for this Owner
Home Financials are based on the most recent Mortgage that was taken out on this home.
Original Mortgage
$329,000
Interest Rate
2.96%
Mortgage Type
New Conventional
Purchase Details
Closed on
Dec 19, 1997
Sold by
Fulton Homes Sales Corp
Bought by
Mier Ruben and Mier Melissa Ann
Home Financials for this Owner
Home Financials are based on the most recent Mortgage that was taken out on this home.
Original Mortgage
$115,450
Interest Rate
7.23%
Mortgage Type
New Conventional
Create a Home Valuation Report for This Property
The Home Valuation Report is an in-depth analysis detailing your home's value as well as a comparison with similar homes in the area
Home Values in the Area
Average Home Value in this Area
Purchase History
| Date | Buyer | Sale Price | Title Company |
|---|---|---|---|
| Phillip Pina Trust | -- | None Listed On Document | |
| Pina Phillip Michael | $417,000 | Pioneer Title Agency Inc | |
| Mier Ruben | $119,050 | Security Title Agency | |
| Fulton Homes Sales Corp | $72,614 | Security Title Agency |
Source: Public Records
Mortgage History
| Date | Status | Borrower | Loan Amount |
|---|---|---|---|
| Previous Owner | Pina Phillip Michael | $329,000 | |
| Previous Owner | Mier Ruben | $115,450 |
Source: Public Records
Tax History
| Year | Tax Paid | Tax Assessment Tax Assessment Total Assessment is a certain percentage of the fair market value that is determined by local assessors to be the total taxable value of land and additions on the property. | Land | Improvement |
|---|---|---|---|---|
| 2025 | $1,394 | $17,892 | -- | -- |
| 2024 | $1,346 | $17,040 | -- | -- |
| 2023 | $1,346 | $34,370 | $6,870 | $27,500 |
| 2022 | $1,299 | $26,050 | $5,210 | $20,840 |
| 2021 | $1,361 | $24,620 | $4,920 | $19,700 |
| 2020 | $1,355 | $22,820 | $4,560 | $18,260 |
| 2019 | $1,303 | $20,680 | $4,130 | $16,550 |
| 2018 | $1,262 | $19,130 | $3,820 | $15,310 |
| 2017 | $1,176 | $17,480 | $3,490 | $13,990 |
| 2016 | $1,133 | $16,530 | $3,300 | $13,230 |
| 2015 | $1,098 | $15,460 | $3,090 | $12,370 |
Source: Public Records
Map
Nearby Homes
- 1594 E Megan St
- 1691 E Gary Dr
- 1402 E Shannon St
- 1456 E Park Ave
- 1445 E Countrywalk Ln
- 1813 E Gail Dr
- 1030 N Mason Dr
- 1126 N Melody Cir
- 935 N Senate St
- 1695 E Monterey St
- 1680 E Sheffield Ave
- 1146 E Dublin St
- 1449 E Kent Ave
- 741 N Soho Place
- 1700 E Kent Ave
- 1310 N Concord Ave
- 750 W Golden St
- 1255 W Sherri Dr
- 1771 E Tulsa St
- 1114 S Surfside Dr
- 1642 E Megan St
- 1610 E Megan St
- 1658 E Megan St
- 1609 E Megan St
- 1672 E Shannon St
- 831 N Cambridge St
- 1578 E Megan St
- 1674 E Megan St
- 1652 E Shannon St
- 1562 E Megan St
- 1593 E Megan St
- 1010 N Cambridge St
- 1642 E Shannon St
- 1611 E Gary Dr
- 1691 E Shannon St
- 1546 E Megan St
- 1621 E Gary Dr
- 1681 E Shannon St
- 1622 E Shannon St
- 1671 E Shannon St
Your Personal Tour Guide
Ask me questions while you tour the home.