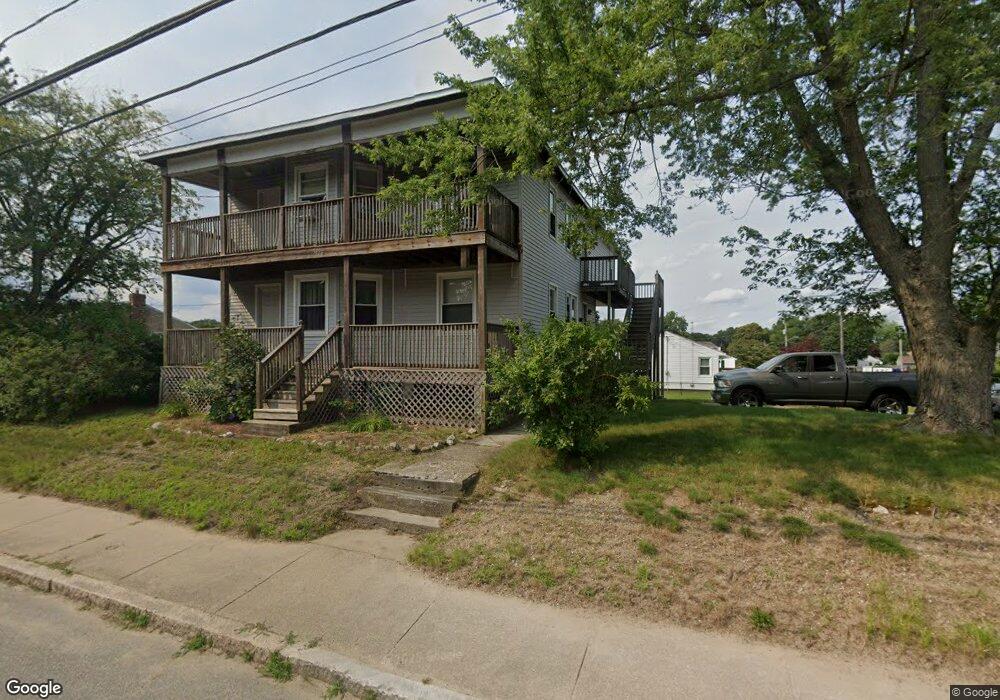
1626 Locust St Fall River, MA 02723
Bank Street NeighborhoodEstimated Value: $454,000 - $591,000
4
Beds
2
Baths
2,202
Sq Ft
$232/Sq Ft
Est. Value
About This Home
This home is located at 1626 Locust St, Fall River, MA 02723 and is currently estimated at $510,453, approximately $231 per square foot. 1626 Locust St is a home located in Bristol County with nearby schools including Mary Fonseca Elementary School, Talbot Innovation School, and B M C Durfee High School.
Ownership History
Date
Name
Owned For
Owner Type
Purchase Details
Closed on
Oct 25, 2002
Sold by
Worsley Robert J and Worsley Catherine P
Bought by
Worsley Eric J and Fernandes Susanne P
Current Estimated Value
Home Financials for this Owner
Home Financials are based on the most recent Mortgage that was taken out on this home.
Original Mortgage
$164,700
Outstanding Balance
$69,898
Interest Rate
6.2%
Mortgage Type
Purchase Money Mortgage
Estimated Equity
$440,555
Create a Home Valuation Report for This Property
The Home Valuation Report is an in-depth analysis detailing your home's value as well as a comparison with similar homes in the area
Home Values in the Area
Average Home Value in this Area
Purchase History
| Date | Buyer | Sale Price | Title Company |
|---|---|---|---|
| Worsley Eric J | $183,000 | -- |
Source: Public Records
Mortgage History
| Date | Status | Borrower | Loan Amount |
|---|---|---|---|
| Open | Worsley Eric J | $164,700 | |
| Previous Owner | Worsley Eric J | $98,300 | |
| Previous Owner | Worsley Eric J | $67,000 |
Source: Public Records
Tax History
| Year | Tax Paid | Tax Assessment Tax Assessment Total Assessment is a certain percentage of the fair market value that is determined by local assessors to be the total taxable value of land and additions on the property. | Land | Improvement |
|---|---|---|---|---|
| 2025 | $5,411 | $472,600 | $135,000 | $337,600 |
| 2024 | $4,949 | $430,700 | $129,900 | $300,800 |
| 2023 | $4,507 | $367,300 | $111,300 | $256,000 |
| 2022 | $4,125 | $326,900 | $101,200 | $225,700 |
| 2021 | $3,803 | $275,000 | $93,700 | $181,300 |
| 2020 | $3,397 | $235,100 | $89,600 | $145,500 |
| 2019 | $3,202 | $219,600 | $85,400 | $134,200 |
| 2018 | $2,950 | $201,800 | $83,800 | $118,000 |
| 2017 | $2,759 | $197,100 | $85,500 | $111,600 |
| 2016 | $2,696 | $197,800 | $89,000 | $108,800 |
| 2015 | $2,545 | $194,600 | $85,700 | $108,900 |
| 2014 | $2,625 | $208,700 | $90,200 | $118,500 |
Source: Public Records
Map
Nearby Homes
Your Personal Tour Guide
Ask me questions while you tour the home.