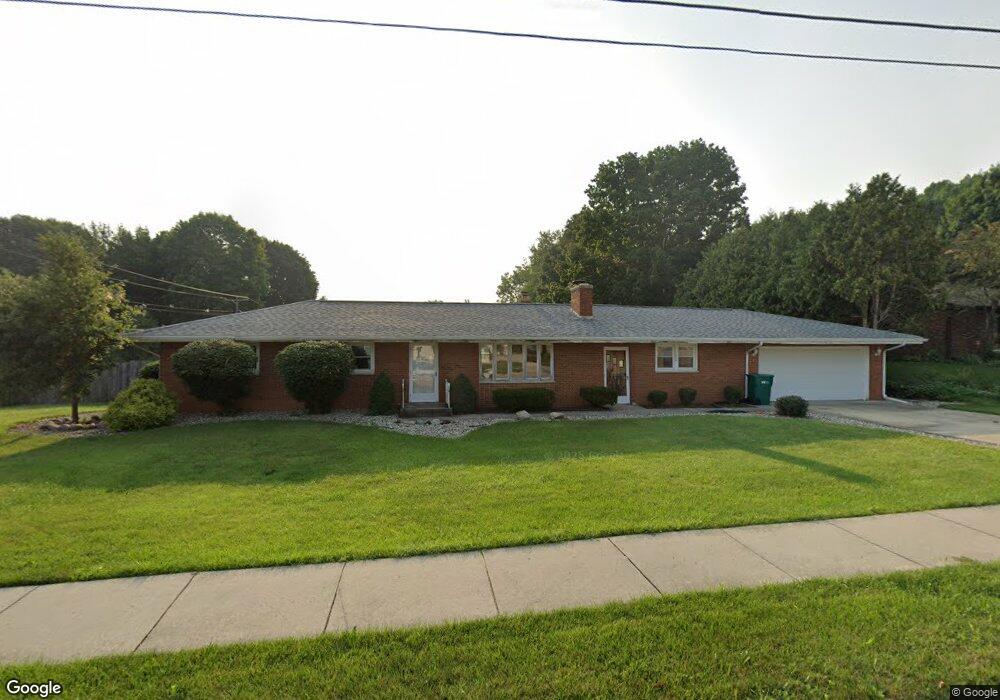
1626 S West St Mishawaka, IN 46544
Estimated Value: $177,000 - $195,000
3
Beds
2
Baths
1,200
Sq Ft
$156/Sq Ft
Est. Value
About This Home
This home is located at 1626 S West St, Mishawaka, IN 46544 and is currently estimated at $186,790, approximately $155 per square foot. 1626 S West St is a home located in St. Joseph County with nearby schools including Meadow's Edge Elementary School, Virgil I. Grissom Middle School, and Penn High School.
Ownership History
Date
Name
Owned For
Owner Type
Purchase Details
Closed on
Jun 13, 2025
Sold by
Jackson Adam C and Jackson Melissa R
Bought by
Valencia Patricia Barrera
Current Estimated Value
Purchase Details
Closed on
Nov 1, 2019
Sold by
Ferguson Joe
Bought by
Jackson Adam Charles and Jackson Jennifer Kate
Purchase Details
Closed on
Jan 26, 2009
Sold by
Jackson Melissa R
Bought by
Jackson Adam C and Jackson Melissa R
Home Financials for this Owner
Home Financials are based on the most recent Mortgage that was taken out on this home.
Original Mortgage
$87,962
Interest Rate
5.08%
Mortgage Type
FHA
Purchase Details
Closed on
Jan 12, 2009
Sold by
The Bank Of New York Mellon Trust Compan
Bought by
Jacksn Melissa R
Home Financials for this Owner
Home Financials are based on the most recent Mortgage that was taken out on this home.
Original Mortgage
$87,962
Interest Rate
5.08%
Mortgage Type
FHA
Purchase Details
Closed on
Oct 2, 2008
Sold by
Spice Anna M
Bought by
Bank Of New York Tr
Create a Home Valuation Report for This Property
The Home Valuation Report is an in-depth analysis detailing your home's value as well as a comparison with similar homes in the area
Home Values in the Area
Average Home Value in this Area
Purchase History
| Date | Buyer | Sale Price | Title Company |
|---|---|---|---|
| Valencia Patricia Barrera | -- | Meridian Title | |
| Jackson Adam Charles | -- | None Available | |
| Jackson Adam C | -- | Investors Titlecorp | |
| Jacksn Melissa R | -- | Investors Titlecorp | |
| Bank Of New York Tr | -- | None Available |
Source: Public Records
Mortgage History
| Date | Status | Borrower | Loan Amount |
|---|---|---|---|
| Previous Owner | Jacksn Melissa R | $87,962 |
Source: Public Records
Tax History Compared to Growth
Tax History
| Year | Tax Paid | Tax Assessment Tax Assessment Total Assessment is a certain percentage of the fair market value that is determined by local assessors to be the total taxable value of land and additions on the property. | Land | Improvement |
|---|---|---|---|---|
| 2024 | $2,279 | $113,700 | $28,000 | $85,700 |
| 2023 | $2,279 | $110,600 | $28,000 | $82,600 |
| 2022 | $2,219 | $111,100 | $28,000 | $83,100 |
| 2021 | $1,137 | $106,800 | $28,000 | $78,800 |
| 2020 | $1,149 | $107,200 | $28,000 | $79,200 |
| 2019 | $985 | $100,500 | $28,000 | $72,500 |
| 2018 | $1,117 | $101,300 | $28,000 | $73,300 |
| 2017 | $1,119 | $99,300 | $28,000 | $71,300 |
| 2016 | $1,139 | $99,300 | $28,000 | $71,300 |
| 2014 | $1,131 | $98,200 | $28,000 | $70,200 |
Source: Public Records
Map
Nearby Homes
- 423 W 14th St
- 427 W 14th St
- 120 E 16th St
- 804 W 15th St
- 130 E 16th St
- 417 W 12th St
- 303 E 16th St
- 617 W 10th St
- 534 W 10th St
- 902 S Main St Unit A-1 & B-2
- 902 S Main St Unit A & B
- 905 Taylor St
- 907 Berkley Cir
- 1006 Berkley Cir
- 114 E 8th St
- 121 W 7th St
- 16470 Petro Dr
- 1212 Michigan Ave
- 1204 Michigan Ave
- 330 W 6th St