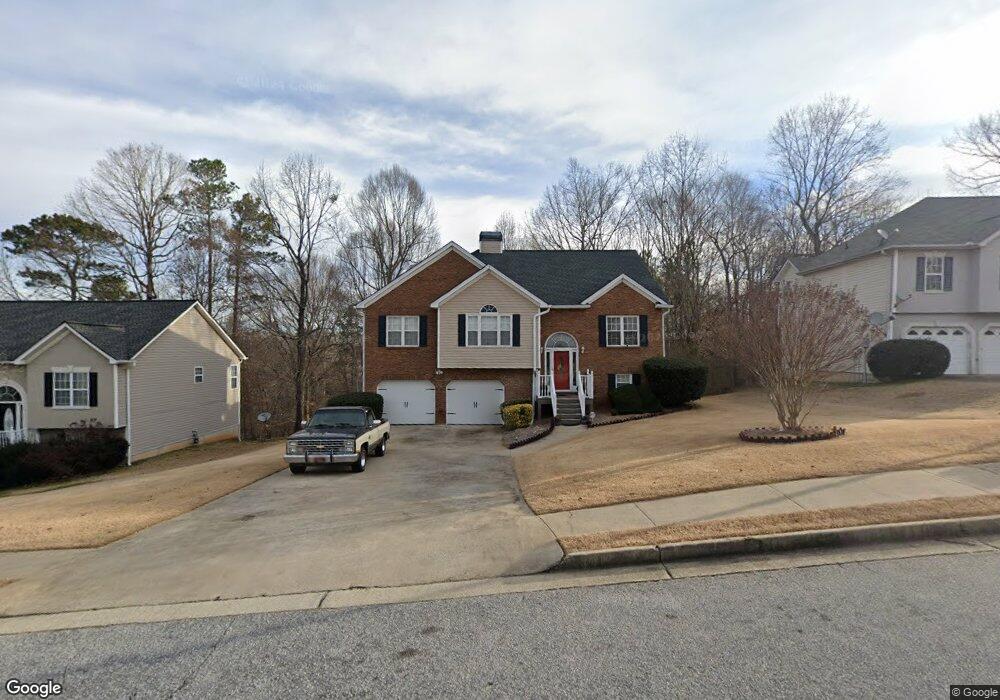
1626 Sloping Tree Way Unit 6 Lithia Springs, GA 30122
Lithia Springs NeighborhoodEstimated Value: $278,000 - $311,000
3
Beds
2
Baths
1,596
Sq Ft
$187/Sq Ft
Est. Value
About This Home
This home is located at 1626 Sloping Tree Way Unit 6, Lithia Springs, GA 30122 and is currently estimated at $298,276, approximately $186 per square foot. 1626 Sloping Tree Way Unit 6 is a home located in Douglas County with nearby schools including Sweetwater Elementary School, Turner Middle School, and Lithia Springs Comprehensive High School.
Ownership History
Date
Name
Owned For
Owner Type
Purchase Details
Closed on
Oct 26, 2011
Sold by
Edwards Lenton Paul
Bought by
Edwards Lenton and Edwards Kim
Current Estimated Value
Home Financials for this Owner
Home Financials are based on the most recent Mortgage that was taken out on this home.
Original Mortgage
$157,358
Outstanding Balance
$109,758
Interest Rate
4.5%
Mortgage Type
FHA
Estimated Equity
$188,518
Purchase Details
Closed on
Jun 2, 2006
Sold by
Jones Brenda S
Bought by
Myers Kim M and Edwards Lenton
Home Financials for this Owner
Home Financials are based on the most recent Mortgage that was taken out on this home.
Original Mortgage
$167,178
Interest Rate
6.49%
Mortgage Type
FHA
Purchase Details
Closed on
Sep 17, 1998
Sold by
Oxford Inc
Bought by
Jones Brenda S
Home Financials for this Owner
Home Financials are based on the most recent Mortgage that was taken out on this home.
Original Mortgage
$100,000
Interest Rate
6.8%
Mortgage Type
New Conventional
Create a Home Valuation Report for This Property
The Home Valuation Report is an in-depth analysis detailing your home's value as well as a comparison with similar homes in the area
Home Values in the Area
Average Home Value in this Area
Purchase History
| Date | Buyer | Sale Price | Title Company |
|---|---|---|---|
| Edwards Lenton | -- | -- | |
| Myers Kim M | $168,500 | -- | |
| Jones Brenda S | $137,100 | -- |
Source: Public Records
Mortgage History
| Date | Status | Borrower | Loan Amount |
|---|---|---|---|
| Open | Edwards Lenton | $157,358 | |
| Previous Owner | Myers Kim M | $167,178 | |
| Previous Owner | Jones Brenda S | $100,000 |
Source: Public Records
Tax History Compared to Growth
Tax History
| Year | Tax Paid | Tax Assessment Tax Assessment Total Assessment is a certain percentage of the fair market value that is determined by local assessors to be the total taxable value of land and additions on the property. | Land | Improvement |
|---|---|---|---|---|
| 2024 | $802 | $110,800 | $24,000 | $86,800 |
| 2023 | $802 | $110,800 | $24,000 | $86,800 |
| 2022 | $832 | $97,440 | $20,000 | $77,440 |
| 2021 | $832 | $78,080 | $17,600 | $60,480 |
| 2020 | $823 | $67,520 | $11,320 | $56,200 |
| 2019 | $662 | $65,360 | $11,320 | $54,040 |
| 2018 | $646 | $63,800 | $11,320 | $52,480 |
| 2017 | $637 | $60,000 | $11,800 | $48,200 |
| 2016 | $470 | $42,760 | $8,760 | $34,000 |
| 2015 | $1,261 | $39,920 | $8,400 | $31,520 |
| 2014 | $1,096 | $34,320 | $7,680 | $26,640 |
| 2013 | -- | $34,440 | $7,800 | $26,640 |
Source: Public Records
Map
Nearby Homes
- 1657 Karsyn Ln
- 859 Aspen Dr
- 2790 Deerfield Dr
- 7306 Mount Vernon Rd
- 7368 Mount Vernon Rd
- 7621 Forest Glen Way Unit 2
- 2019 Dutchess Rd
- 3138 Beechwood Dr
- 6889 Kingsboro Dr Unit 2
- 2948 Windsor Dr
- 1657 Bradmere Ln
- 542 Hasty Dr
- 6627 Coventry Point
- 3245 W Anderson Dr
- 6718 Roscommon Dr
- 1682 Walton Reserve Blvd
- 3940 Fairhaven Rd
- 2765 Montie Ct
- 7187 Walton Reserve Ln
- 1634 Sloping Tree Way
- 1618 Sloping Tree Way
- 1642 Sloping Tree Way
- 1650 Sloping Tree Way
- 1206 Silver Moon Trail
- 1212 Silver Moon Trail
- 1198 Silver Moon Trail
- 1619 Sloping Tree Way
- 1658 Sloping Tree Way
- 1635 Sloping Tree Way Unit 6
- 1627 Sloping Tree Way
- 1220 Silver Moon Trail Unit 6
- 1643 Sloping Tree Way
- 1164 Silver Moon Trail Unit 6
- 0 Sloping Tree Way Unit 7381484
- 0 Sloping Tree Way
- 1651 Sloping Tree Way
- 1651 Sloping Tree Way Unit 6
- 1668 Sloping Tree Way
- 1228 Silver Moon Trail Unit 6