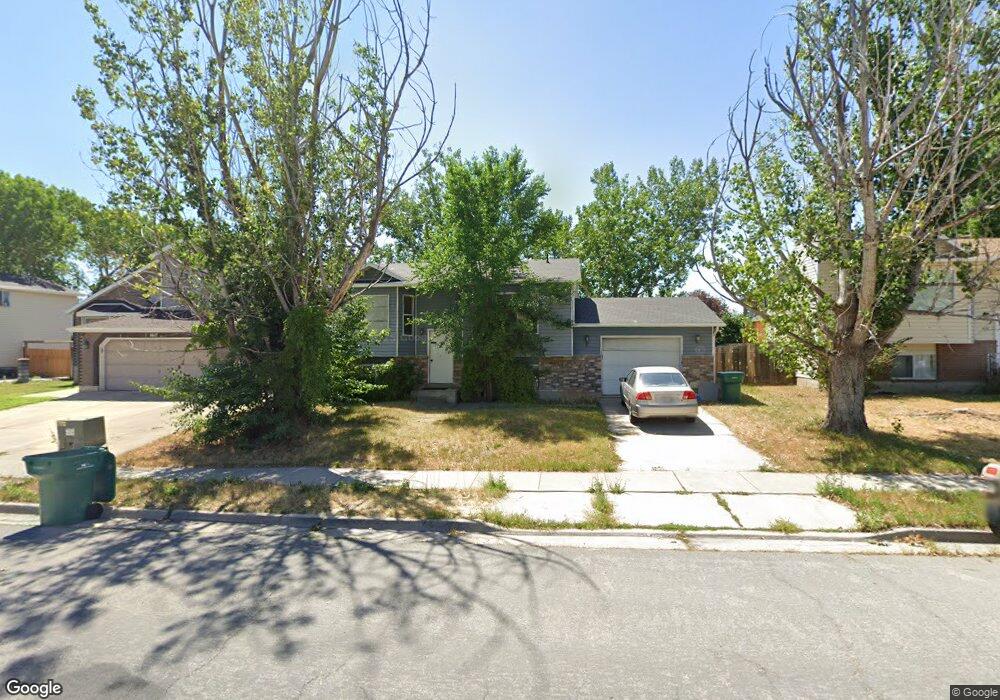
1627 N 275 W Layton, UT 84041
Estimated Value: $385,265 - $437,000
3
Beds
1
Bath
802
Sq Ft
$504/Sq Ft
Est. Value
About This Home
This home is located at 1627 N 275 W, Layton, UT 84041 and is currently estimated at $403,816, approximately $503 per square foot. 1627 N 275 W is a home located in Davis County with nearby schools including Lincoln Elementary School, North Layton Junior High School, and Northridge High School.
Ownership History
Date
Name
Owned For
Owner Type
Purchase Details
Closed on
Mar 9, 2001
Sold by
Harrow Courtney E and Montgomery Robert Dee
Bought by
Montgomery Robert Dee and Montgomery Courtney
Current Estimated Value
Home Financials for this Owner
Home Financials are based on the most recent Mortgage that was taken out on this home.
Original Mortgage
$101,000
Outstanding Balance
$36,565
Interest Rate
7.11%
Estimated Equity
$367,252
Purchase Details
Closed on
Jul 28, 1997
Sold by
Harrow Courtney E
Bought by
Harrow Courtney E and Montgomery Robert Dee
Purchase Details
Closed on
Mar 4, 1996
Sold by
Macaluso Phillip J
Bought by
Harrow Courtney E
Home Financials for this Owner
Home Financials are based on the most recent Mortgage that was taken out on this home.
Original Mortgage
$76,720
Interest Rate
9.25%
Create a Home Valuation Report for This Property
The Home Valuation Report is an in-depth analysis detailing your home's value as well as a comparison with similar homes in the area
Home Values in the Area
Average Home Value in this Area
Purchase History
| Date | Buyer | Sale Price | Title Company |
|---|---|---|---|
| Montgomery Robert Dee | -- | Meridian Title Company | |
| Harrow Courtney E | -- | -- | |
| Harrow Courtney E | -- | Associated Title Company |
Source: Public Records
Mortgage History
| Date | Status | Borrower | Loan Amount |
|---|---|---|---|
| Open | Montgomery Robert Dee | $101,000 | |
| Closed | Harrow Courtney E | $76,720 |
Source: Public Records
Tax History Compared to Growth
Tax History
| Year | Tax Paid | Tax Assessment Tax Assessment Total Assessment is a certain percentage of the fair market value that is determined by local assessors to be the total taxable value of land and additions on the property. | Land | Improvement |
|---|---|---|---|---|
| 2025 | $1,808 | $189,750 | $89,910 | $99,840 |
| 2024 | $1,732 | $183,150 | $105,447 | $77,703 |
| 2023 | $1,744 | $325,000 | $131,892 | $193,108 |
| 2022 | $1,755 | $177,650 | $67,764 | $109,886 |
| 2021 | $1,630 | $246,000 | $90,054 | $155,946 |
| 2020 | $1,471 | $213,000 | $77,849 | $135,151 |
| 2019 | $1,459 | $207,000 | $75,880 | $131,120 |
| 2018 | $1,306 | $186,000 | $75,880 | $110,120 |
| 2016 | $1,209 | $88,825 | $22,884 | $65,941 |
| 2015 | $1,159 | $80,850 | $22,884 | $57,966 |
| 2014 | $1,020 | $72,693 | $22,884 | $49,809 |
| 2013 | -- | $79,621 | $20,620 | $59,001 |
Source: Public Records
Map
Nearby Homes