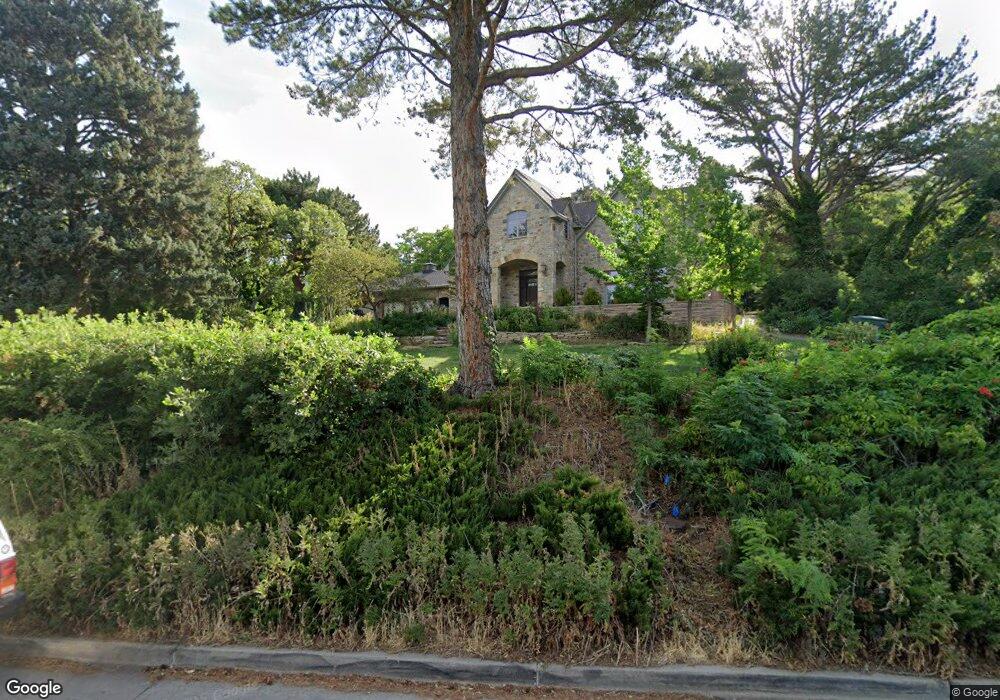
1627 S Wasatch Dr Salt Lake City, UT 84108
East Bench NeighborhoodEstimated Value: $1,846,000 - $4,185,000
5
Beds
4
Baths
5,023
Sq Ft
$581/Sq Ft
Est. Value
About This Home
This home is located at 1627 S Wasatch Dr, Salt Lake City, UT 84108 and is currently estimated at $2,916,012, approximately $580 per square foot. 1627 S Wasatch Dr is a home located in Salt Lake County with nearby schools including Indian Hills Elementary School, Hillside Middle School, and Highland High School.
Ownership History
Date
Name
Owned For
Owner Type
Purchase Details
Closed on
Sep 11, 2018
Sold by
Martinez Diana D and Martinez Cutter Trust
Bought by
Martinez Diana D and Martinez Cutter Trust
Current Estimated Value
Purchase Details
Closed on
Jan 2, 2014
Sold by
Cutter Jeffrey Howard
Bought by
Martinez Cutter Trust and Martinez Diana D
Purchase Details
Closed on
Oct 23, 2013
Sold by
Neeley Gary L and Neeley Susann
Bought by
Cutter Jeffrey Howard
Purchase Details
Closed on
Mar 5, 1996
Sold by
Hogle Hugh H and Hogle Carol B
Bought by
Neeley Gary L and Neeley Susann
Home Financials for this Owner
Home Financials are based on the most recent Mortgage that was taken out on this home.
Original Mortgage
$565,000
Interest Rate
7%
Create a Home Valuation Report for This Property
The Home Valuation Report is an in-depth analysis detailing your home's value as well as a comparison with similar homes in the area
Home Values in the Area
Average Home Value in this Area
Purchase History
| Date | Buyer | Sale Price | Title Company |
|---|---|---|---|
| Martinez Diana D | -- | None Available | |
| Martinez Cutter Trust | -- | None Available | |
| Cutter Jeffrey Howard | -- | Mountain View Title & Escrow | |
| Neeley Gary L | -- | -- | |
| Neeley Gary L | -- | -- |
Source: Public Records
Mortgage History
| Date | Status | Borrower | Loan Amount |
|---|---|---|---|
| Previous Owner | Neeley Gary L | $565,000 |
Source: Public Records
Tax History Compared to Growth
Tax History
| Year | Tax Paid | Tax Assessment Tax Assessment Total Assessment is a certain percentage of the fair market value that is determined by local assessors to be the total taxable value of land and additions on the property. | Land | Improvement |
|---|---|---|---|---|
| 2025 | $11,584 | $2,299,600 | $592,600 | $1,707,000 |
| 2024 | $11,584 | $2,210,300 | $575,000 | $1,635,300 |
| 2023 | $11,584 | $1,830,600 | $501,700 | $1,328,900 |
| 2022 | $10,584 | $1,826,300 | $491,800 | $1,334,500 |
| 2021 | $10,044 | $1,569,200 | $400,100 | $1,169,100 |
| 2020 | $9,252 | $1,375,800 | $381,200 | $994,600 |
| 2019 | $9,994 | $1,398,200 | $381,200 | $1,017,000 |
| 2018 | $9,893 | $1,347,800 | $381,200 | $966,600 |
| 2017 | $10,423 | $1,330,300 | $371,000 | $959,300 |
| 2016 | $10,773 | $1,305,700 | $299,100 | $1,006,600 |
| 2015 | $9,688 | $1,113,000 | $324,500 | $788,500 |
| 2014 | $9,123 | $1,039,700 | $309,600 | $730,100 |
Source: Public Records
Map
Nearby Homes
- 2662 E Comanche Dr
- 2618 E Skyline Dr
- 1769 S Foothill Dr
- 1802 S Wasatch Dr
- 2536 E Kensington Ave
- 1825 S 2600 E
- 2758 E Comanche Dr
- 1800 S Devonshire Dr Unit 8
- 2400 E Logan Way
- 1572 Sunset Oaks Dr
- 1881 Foothill Dr
- 1506 S Canterbury Dr
- 2842 E Oakbrook Cir
- 1908 S 2600 E
- 1502 S 2400 E
- 2353 E Logan Cir
- 2326 E 1700 S
- 1585 S 2300 E
- 1423 S Ambassador Way
- 1940 S 2500 E
- 1627 Wasatch Dr
- 1617 Wasatch Dr
- 1643 S Wasatch Dr
- 1643 Wasatch Dr
- 2610 Skyline Dr
- 1595 Wasatch Dr
- 2610 E Skyline Dr
- 1632 S Wasatch Dr
- 1632 Wasatch Dr
- 1644 S Wasatch Dr
- 1620 S Wasatch Dr
- 1620 Wasatch Dr
- 1644 Wasatch Dr
- 2618 Skyline Dr
- 2662 Comanche Dr
- 1695 S Wasatch Dr
- 1695 Wasatch Dr
- 1596 Wasatch Dr
- 1596 S Wasatch Dr
- 2660 E Comanche Dr