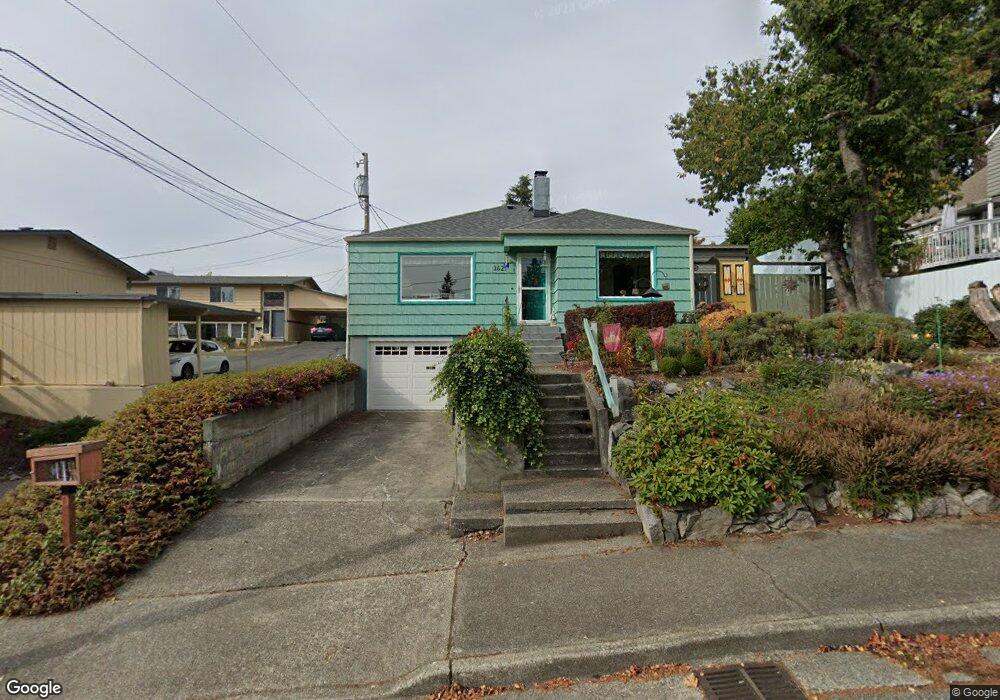
1627 Trenton Ave Bremerton, WA 98310
Manette NeighborhoodEstimated Value: $407,000 - $448,000
2
Beds
1
Bath
811
Sq Ft
$529/Sq Ft
Est. Value
About This Home
This home is located at 1627 Trenton Ave, Bremerton, WA 98310 and is currently estimated at $429,423, approximately $529 per square foot. 1627 Trenton Ave is a home located in Kitsap County with nearby schools including Armin Jahr Elementary School, Mountain View Middle School, and Bremerton High School.
Ownership History
Date
Name
Owned For
Owner Type
Purchase Details
Closed on
Jun 20, 2006
Sold by
Thompson Ronald R and Thompson Kristina M
Bought by
Weckerly Joseph W and Weckerly Sharon N
Current Estimated Value
Purchase Details
Closed on
Aug 26, 2004
Sold by
Hustead Deborah L
Bought by
Thompson Ronald R and Thompson Kristina M
Purchase Details
Closed on
May 12, 1999
Sold by
Whitsett Nola
Bought by
Hustead Deborah L
Home Financials for this Owner
Home Financials are based on the most recent Mortgage that was taken out on this home.
Original Mortgage
$97,350
Interest Rate
6.92%
Purchase Details
Closed on
Sep 7, 1995
Sold by
Thomas Joan Frances
Bought by
Whitsett Nola
Home Financials for this Owner
Home Financials are based on the most recent Mortgage that was taken out on this home.
Original Mortgage
$45,000
Interest Rate
7.83%
Mortgage Type
Seller Take Back
Purchase Details
Closed on
Nov 2, 1994
Sold by
Thomas Joan Frances and Hallman Mary Elizabeth
Bought by
Thomas Joan Frances
Create a Home Valuation Report for This Property
The Home Valuation Report is an in-depth analysis detailing your home's value as well as a comparison with similar homes in the area
Home Values in the Area
Average Home Value in this Area
Purchase History
| Date | Buyer | Sale Price | Title Company |
|---|---|---|---|
| Weckerly Joseph W | $243,780 | First American Title Ins | |
| Thompson Ronald R | $156,000 | First American Title Ins | |
| Hustead Deborah L | $102,500 | Land Title Company | |
| Whitsett Nola | $70,000 | Land Title Company | |
| Thomas Joan Frances | -- | Land Title Company |
Source: Public Records
Mortgage History
| Date | Status | Borrower | Loan Amount |
|---|---|---|---|
| Previous Owner | Hustead Deborah L | $97,350 | |
| Previous Owner | Whitsett Nola | $45,000 |
Source: Public Records
Tax History Compared to Growth
Tax History
| Year | Tax Paid | Tax Assessment Tax Assessment Total Assessment is a certain percentage of the fair market value that is determined by local assessors to be the total taxable value of land and additions on the property. | Land | Improvement |
|---|---|---|---|---|
| 2026 | $3,211 | $363,970 | $110,150 | $253,820 |
| 2025 | $3,211 | $363,970 | $110,150 | $253,820 |
| 2024 | $3,099 | $363,970 | $110,150 | $253,820 |
| 2023 | $3,203 | $363,970 | $110,150 | $253,820 |
| 2022 | $2,969 | $303,320 | $91,800 | $211,520 |
| 2021 | $2,899 | $271,120 | $69,880 | $201,240 |
| 2020 | $2,772 | $259,030 | $66,580 | $192,450 |
| 2019 | $2,485 | $240,620 | $61,850 | $178,770 |
| 2018 | $2,477 | $166,710 | $47,220 | $119,490 |
| 2017 | $2,183 | $166,710 | $47,220 | $119,490 |
| 2016 | $2,026 | $146,400 | $41,420 | $104,980 |
| 2015 | $1,813 | $130,390 | $43,650 | $86,740 |
| 2014 | -- | $130,390 | $43,650 | $86,740 |
| 2013 | -- | $130,390 | $43,650 | $86,740 |
Source: Public Records
Map
Nearby Homes
- 191 x Nipsic Ave
- 192 x Nipsic Ave
- 190 x Nipsic Ave
- 2309 Terrace St
- 2313 Cascade Trail
- 2123 E 14th St
- 2013 E 16th St
- 2105 E Highlands St
- 1021 Shore Dr
- 1011 Ironsides Ave
- 1139 Pitt Ave
- 1157 Wheaton Way
- 1149 Wheaton Way
- 609 Shore Dr
- 201 Shore Dr
- 2809 NE Stone Way
- 2375 Schley Blvd
- 2540 Filbert Ave
- 1008 Samara St
- 110 11th Street Place
- 2651 E 17th St
- 1617 Trenton Ave
- 1615 Trenton Ave
- 2649 E 17th St
- 1619 Trenton Ave
- 2645 E 17th St
- 2643 E 17th St
- 2706 E 16th St
- 1703 Trenton Ave
- 2640 E 17th St
- 1624 Vandalia Ave
- 2639 E 17th St
- 1607 Trenton Ave
- 2638 E 17th St
- 1616 Vandalia Ave
- 2636 E 17th St
- 1727 Trenton Ave
- 1628 Trenton Ave
- 1712 Trenton Ave
- 1610 Vandalia Ave